Lavender Figures
10 figures from peer-reviewed research
A PRISMA flow diagram tracks the study selection process from initial database search through screening and eligibility assessment to final inclusion in the aroma inhalation therapy meta-analysis.
A systematic literature review and meta-analysis of the clinical effects of aroma …
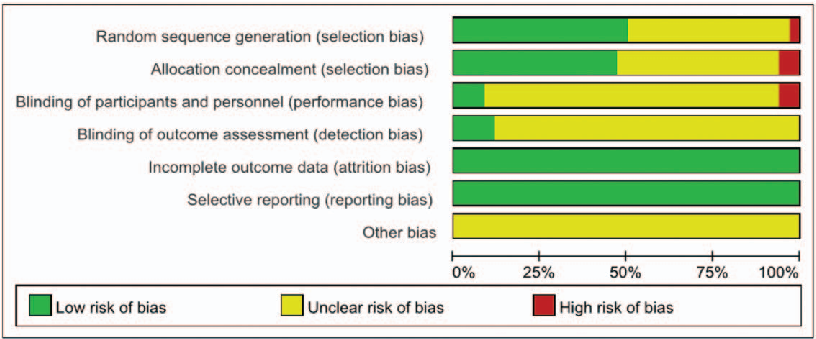
Risk of bias assessment across included studies evaluates methodological quality domains such as randomization, blinding, and outcome reporting in aroma therapy trials.
A systematic literature review and meta-analysis of the clinical effects of aroma …
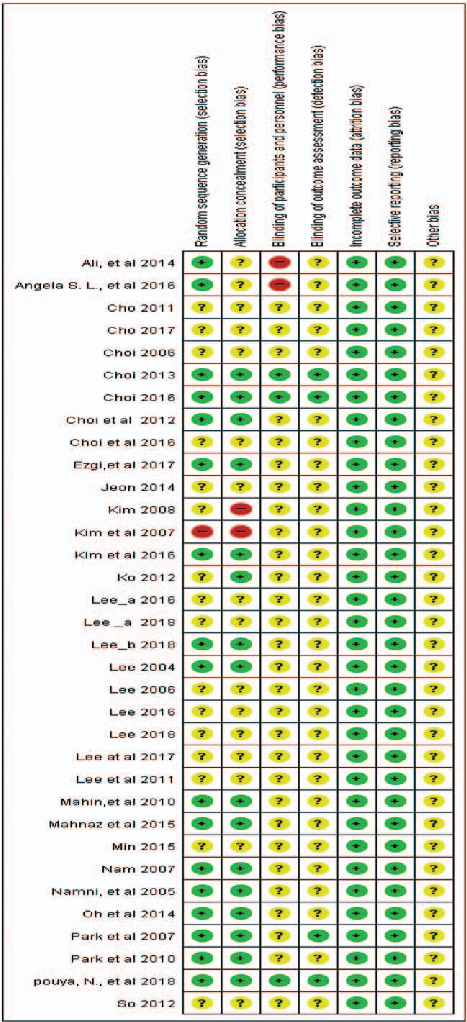
Traffic-light visualization of risk of bias for individual studies included in the aroma inhalation therapy meta-analysis, generated using RevMan software, reveals varying methodological quality.
A systematic literature review and meta-analysis of the clinical effects of aroma …
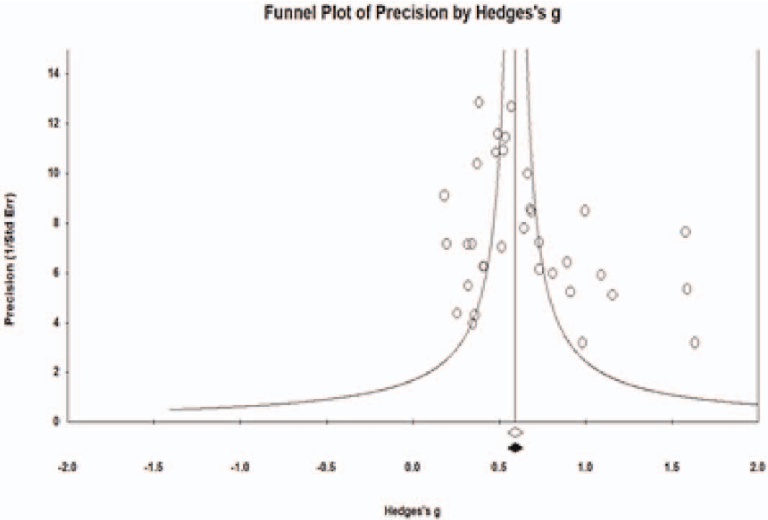
Funnel plot analysis assesses potential publication bias among studies included in the meta-analysis of aroma inhalation therapy for sleep problems, with symmetry indicating low risk.
A systematic literature review and meta-analysis of the clinical effects of aroma …
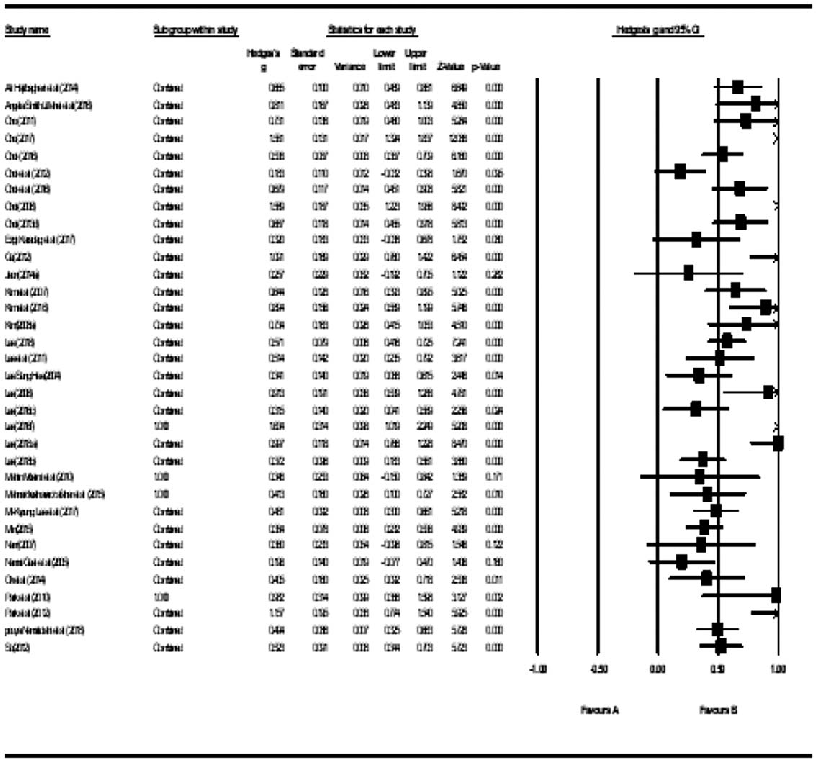
Forest plot of pooled effect sizes from the aroma inhalation therapy meta-analysis displays individual study results and the overall combined effect on sleep quality outcomes.
A systematic literature review and meta-analysis of the clinical effects of aroma …
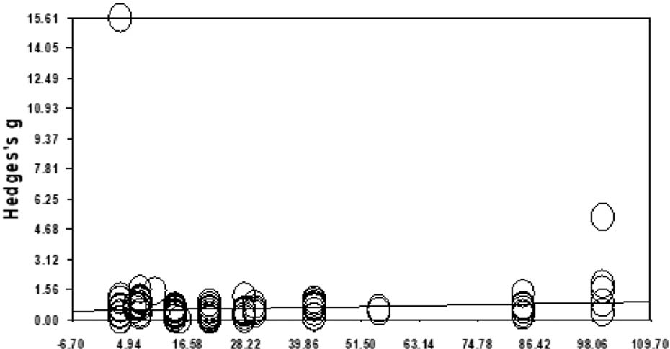
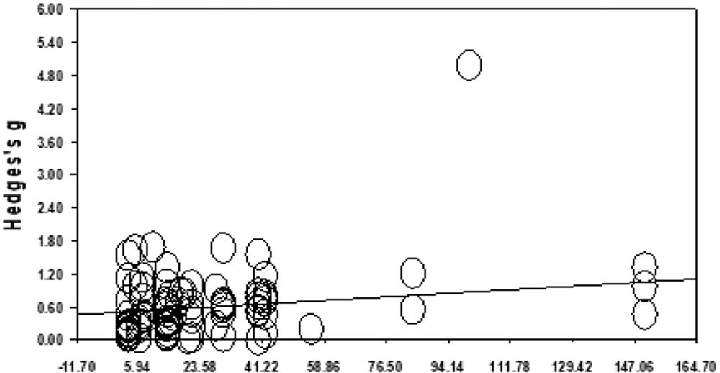
Meta-regression analysis examines whether the effectiveness of aroma inhalation therapy for sleep problems varies by program duration or publication year, revealing trends in the slope of the primary outcome.
A systematic literature review and meta-analysis of the clinical effects of aroma …
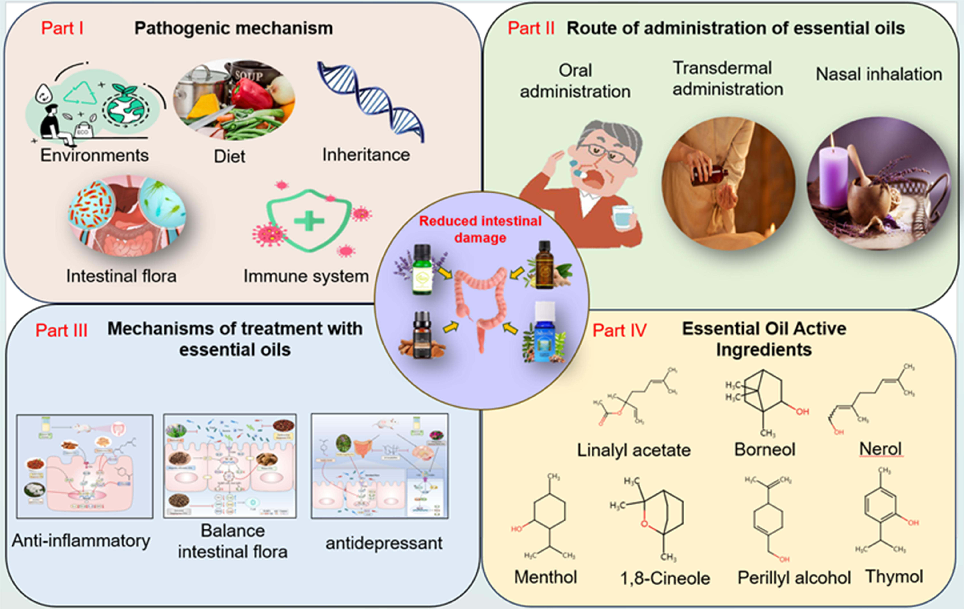
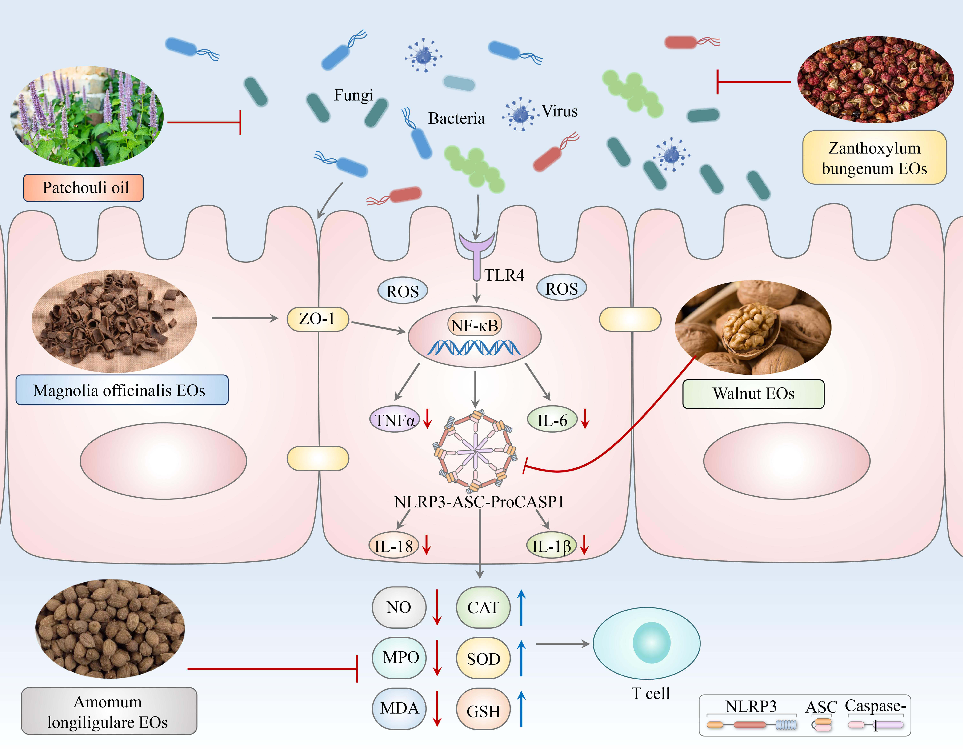
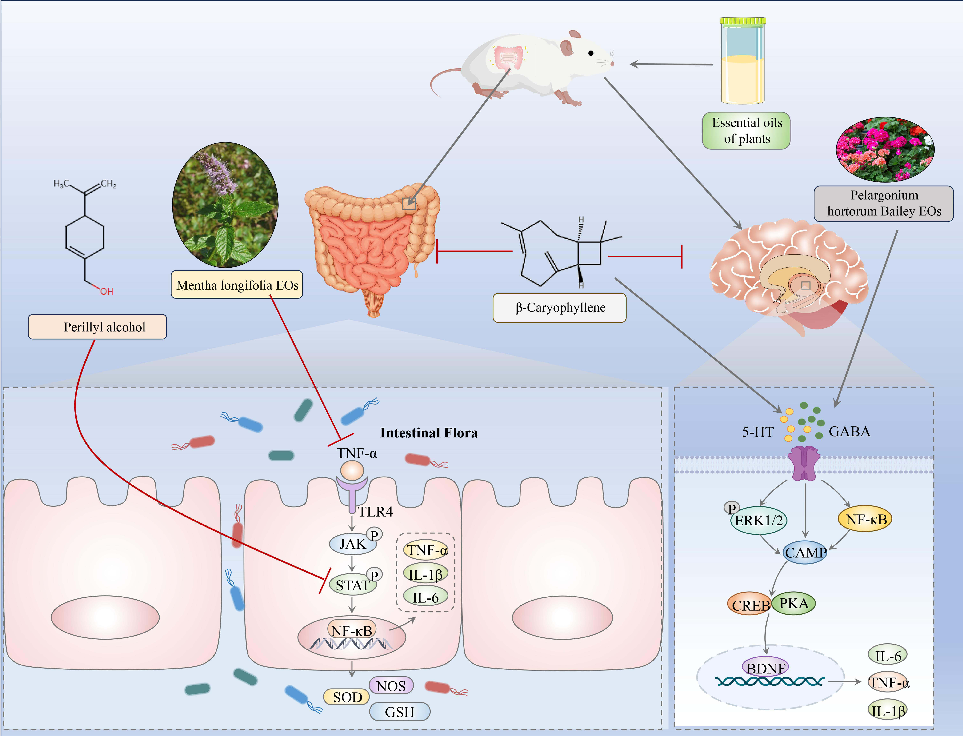
Graphical Abstract
Therapeutic Potential of Essential Oils Against Ulcerative Colitis: A Review.
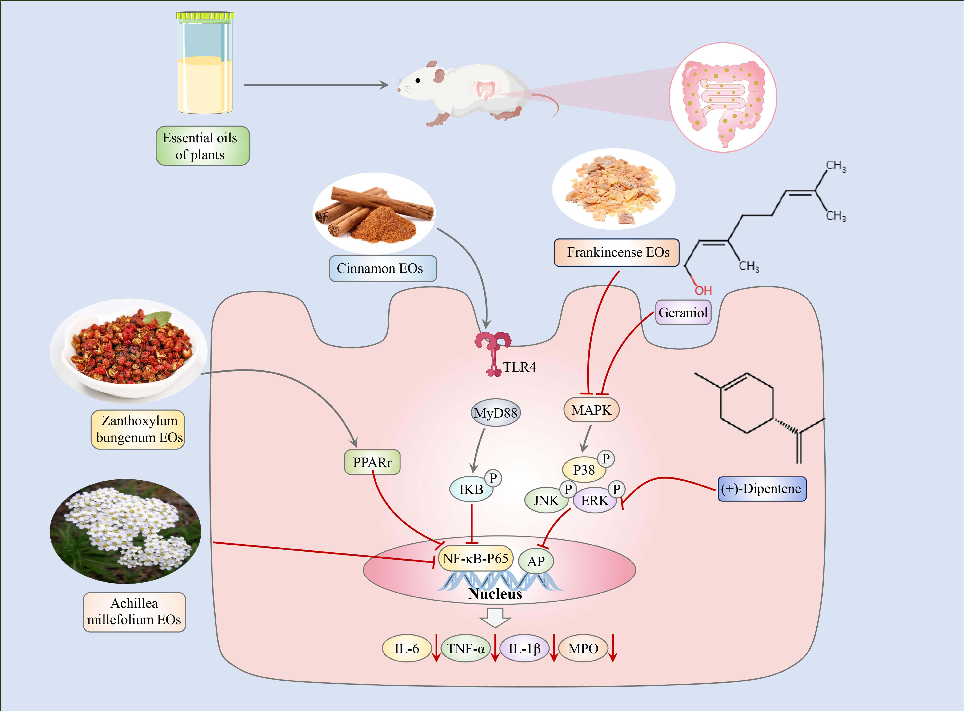
Therapeutic Potential of Essential Oils Against Ulcerative Colitis: A Review.
Therapeutic Potential of Essential Oils Against Ulcerative Colitis: A Review.
Therapeutic Potential of Essential Oils Against Ulcerative Colitis: A Review.