Holy Basil Figures
6 figures from peer-reviewed research
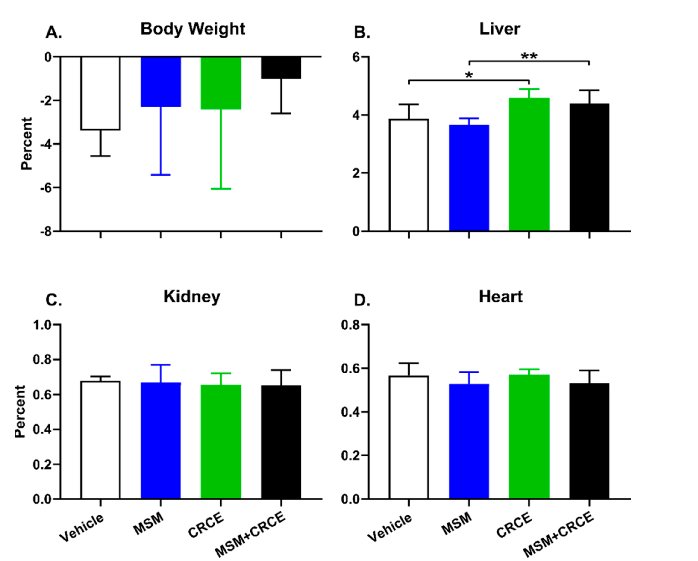
Extended molecular analysis data examining the effects of CBD-rich cannabis extract and MSM on cellular detoxification pathways. The results contribute to understanding the safety implications of co-supplementation.
Safety and Molecular-Toxicological Implications of Cannabidiol-Rich Cannabis Extract and Methylsulfonylmethane Co-Administration.
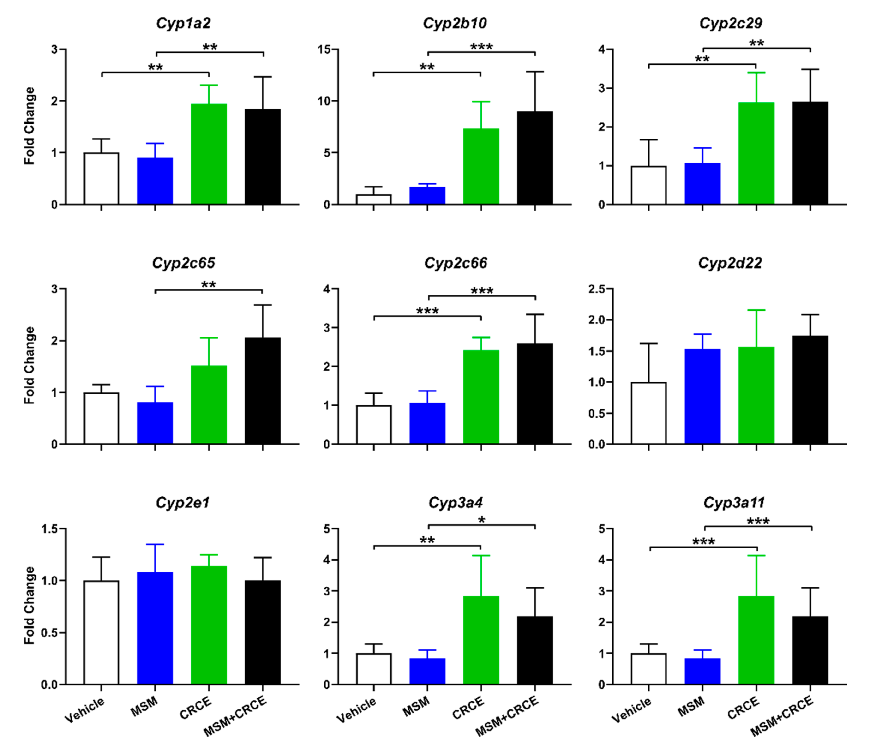
Intrahepatic expression of cytochrome P450 enzymes in response to MSM, CBD-rich cannabis extract (CRCE), or their combination. Alterations in CYP450 expression are critical for assessing drug-supplement interaction potential and metabolic safety.
Safety and Molecular-Toxicological Implications of Cannabidiol-Rich Cannabis Extract and Methylsulfonylmethane Co-Administration.
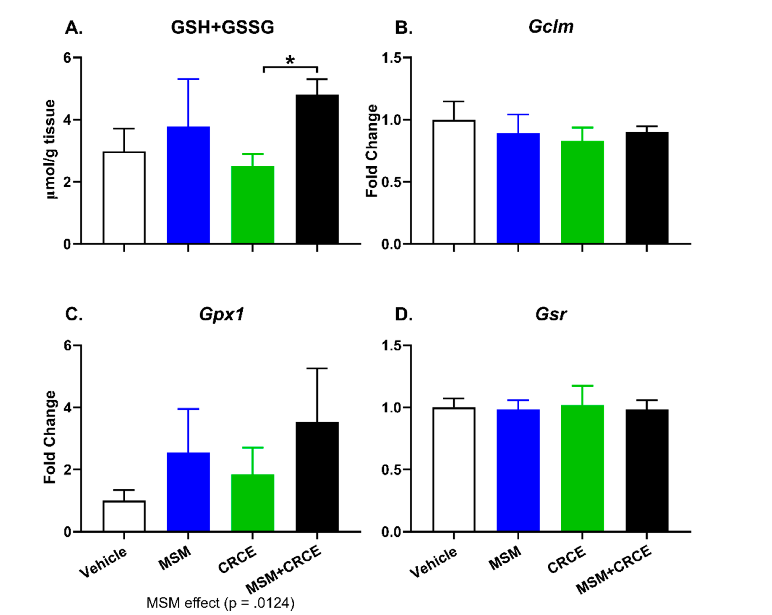
Effects of MSM, CBD-rich cannabis extract, and their combination on intrahepatic glutathione synthesis and related gene expression. Glutathione is a key antioxidant, and changes in its production may indicate shifts in the liver's oxidative stress response.
Safety and Molecular-Toxicological Implications of Cannabidiol-Rich Cannabis Extract and Methylsulfonylmethane Co-Administration.
Isolate Code Oil Degradation (%) PHA Content (%) CDW(g/L)
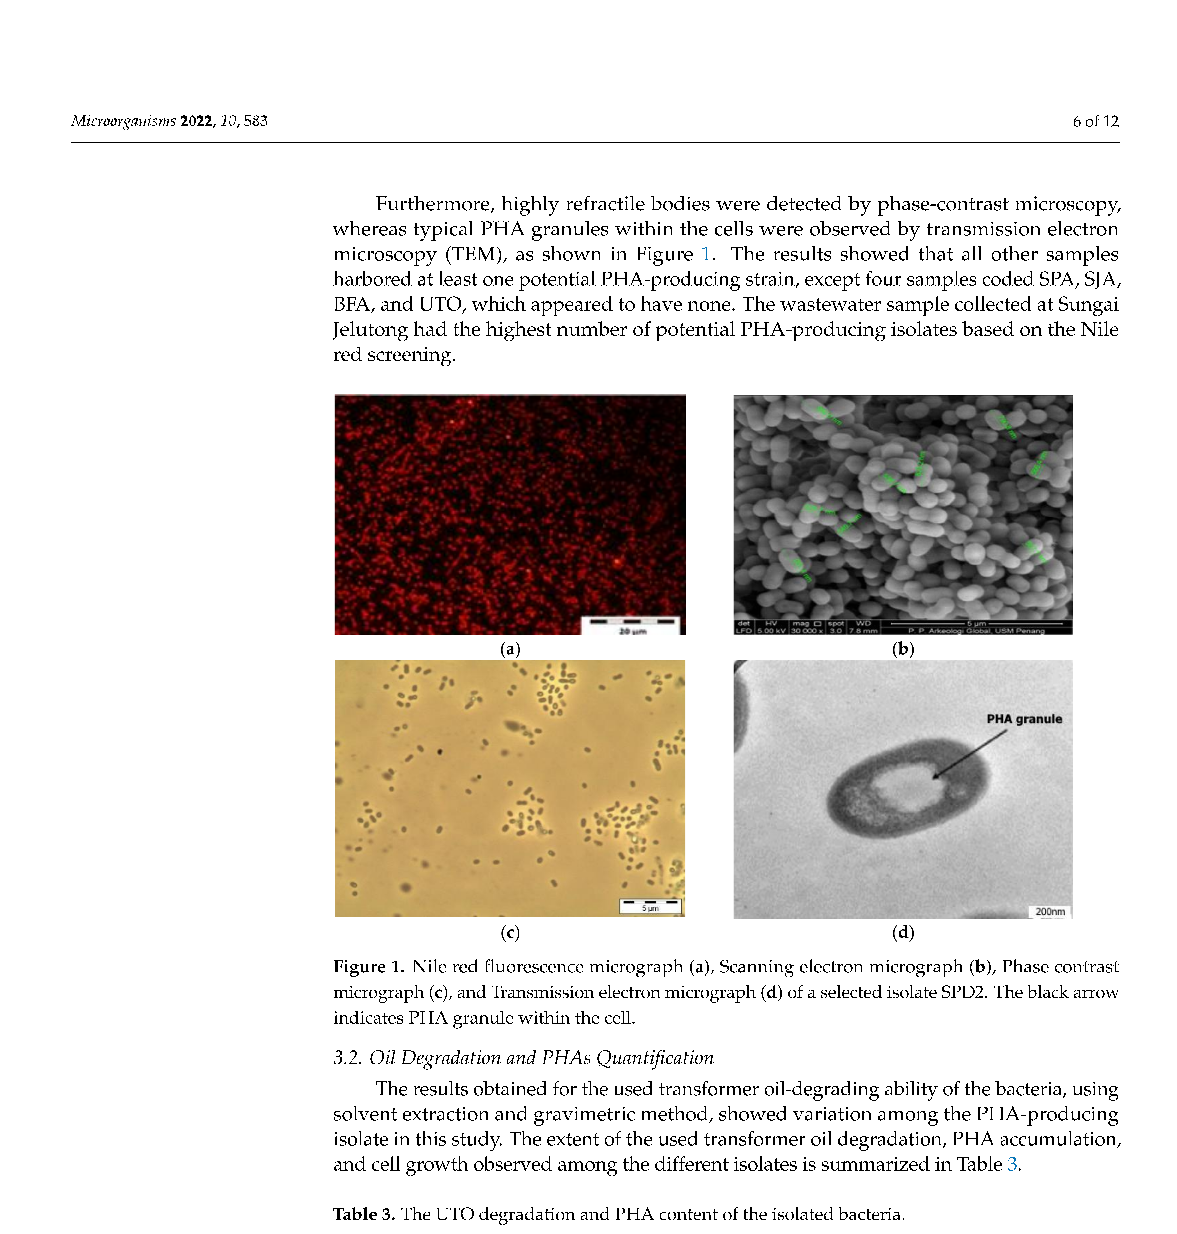
Bioprospecting and Molecular Identification of Used Transformer Oil-Degrading Bacteria for Bioplastics Production.
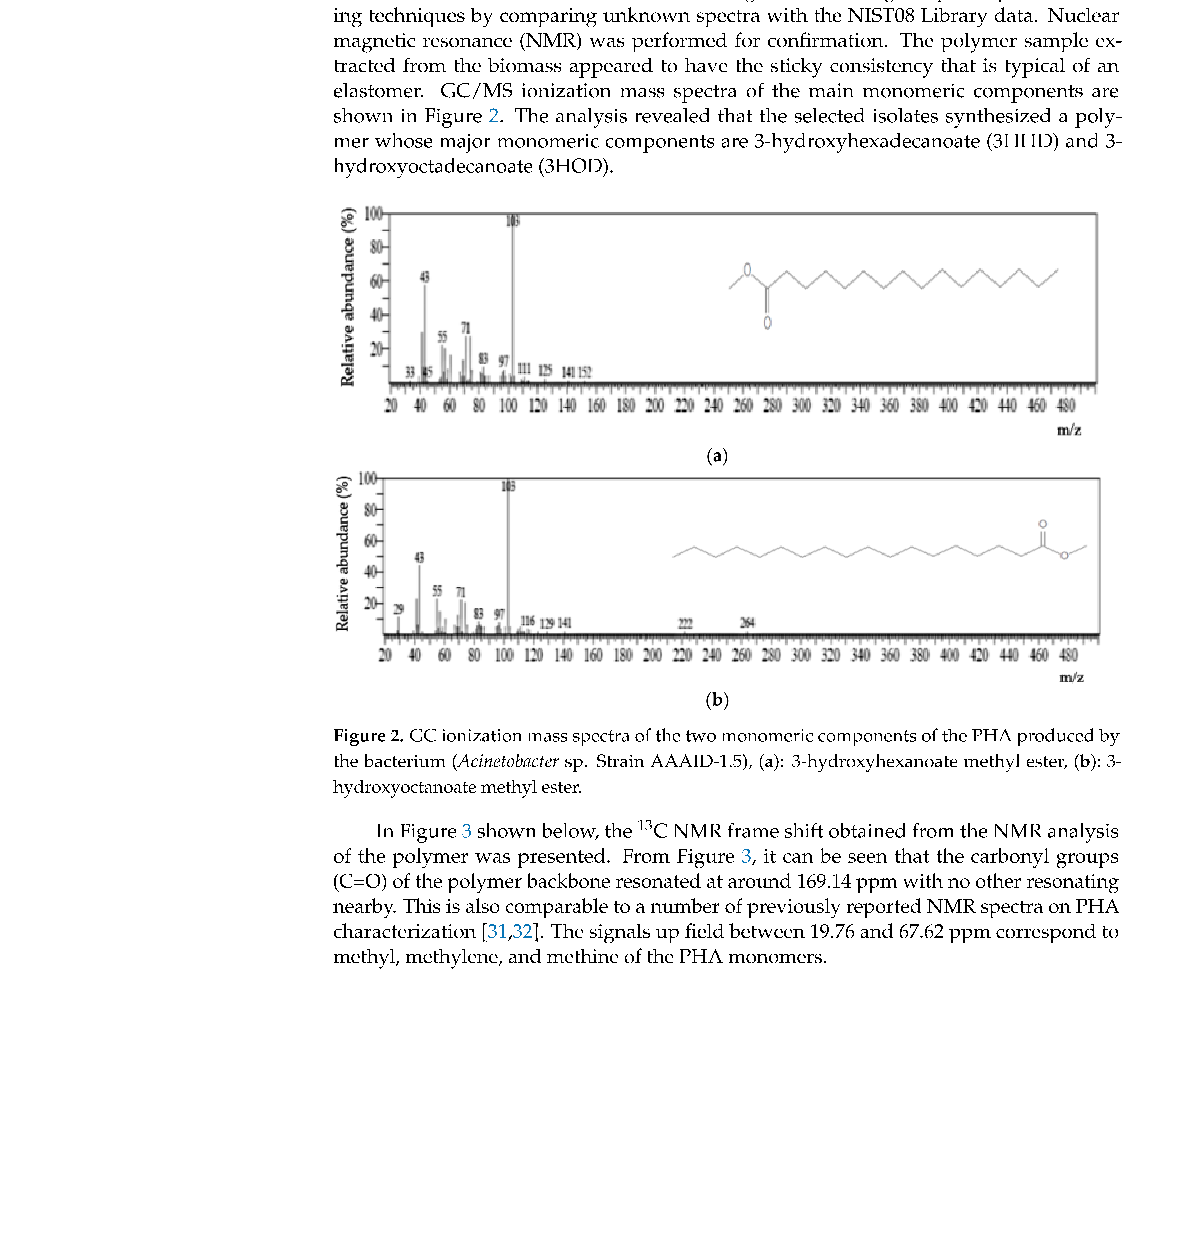
Bioprospecting and Molecular Identification of Used Transformer Oil-Degrading Bacteria for Bioplastics Production.
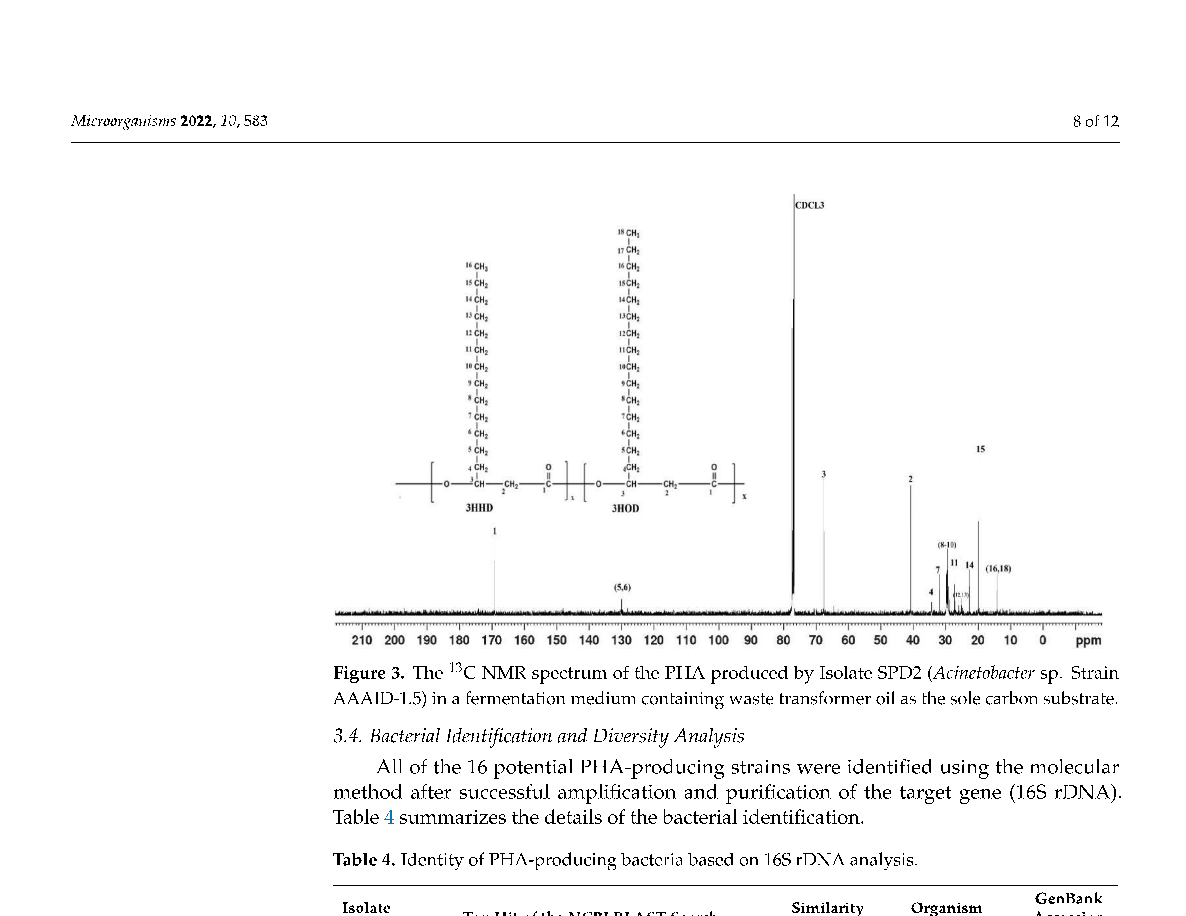
Bioprospecting and Molecular Identification of Used Transformer Oil-Degrading Bacteria for Bioplastics Production.