Apigenin Figures
9 figures from peer-reviewed research
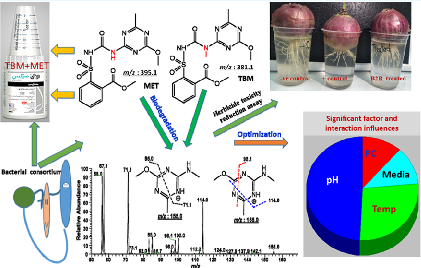
Biodegradation and Subsequent Toxicity Reduction of Co-contaminants Tribenuron Methyl and Metsulfuron Methyl …
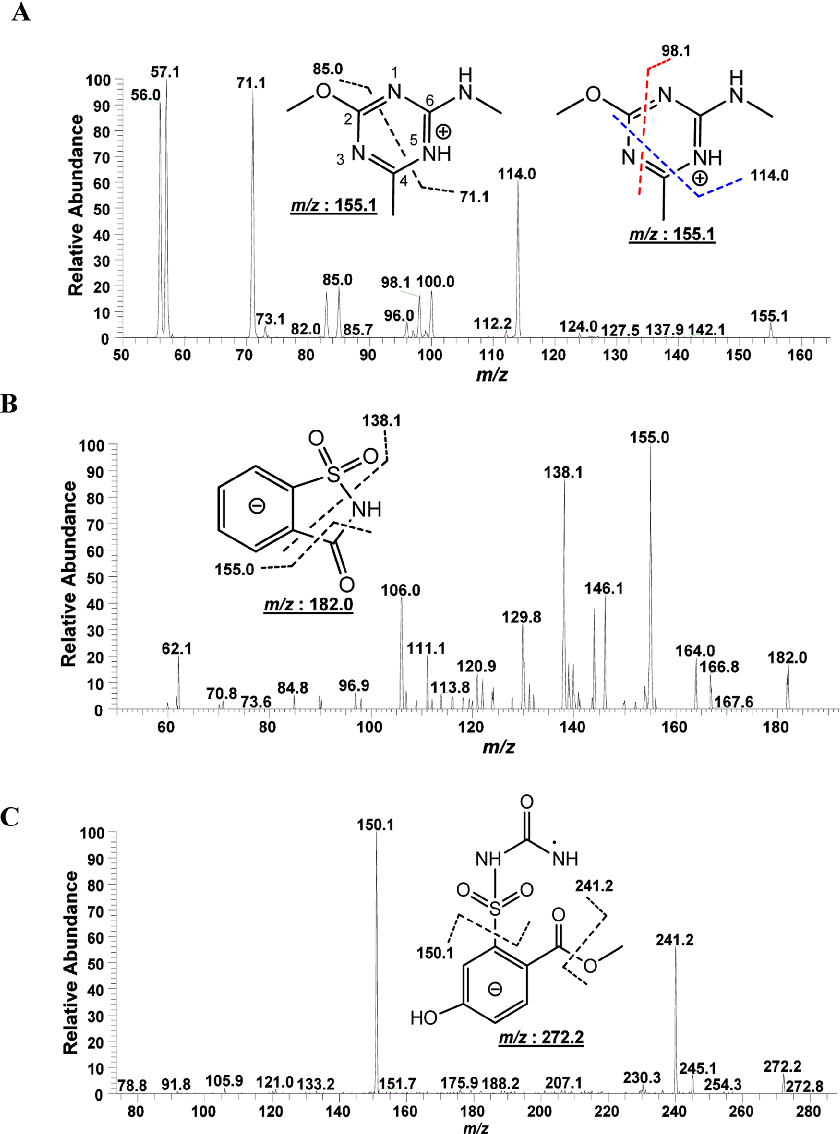
Biodegradation and Subsequent Toxicity Reduction of Co-contaminants Tribenuron Methyl and Metsulfuron Methyl …
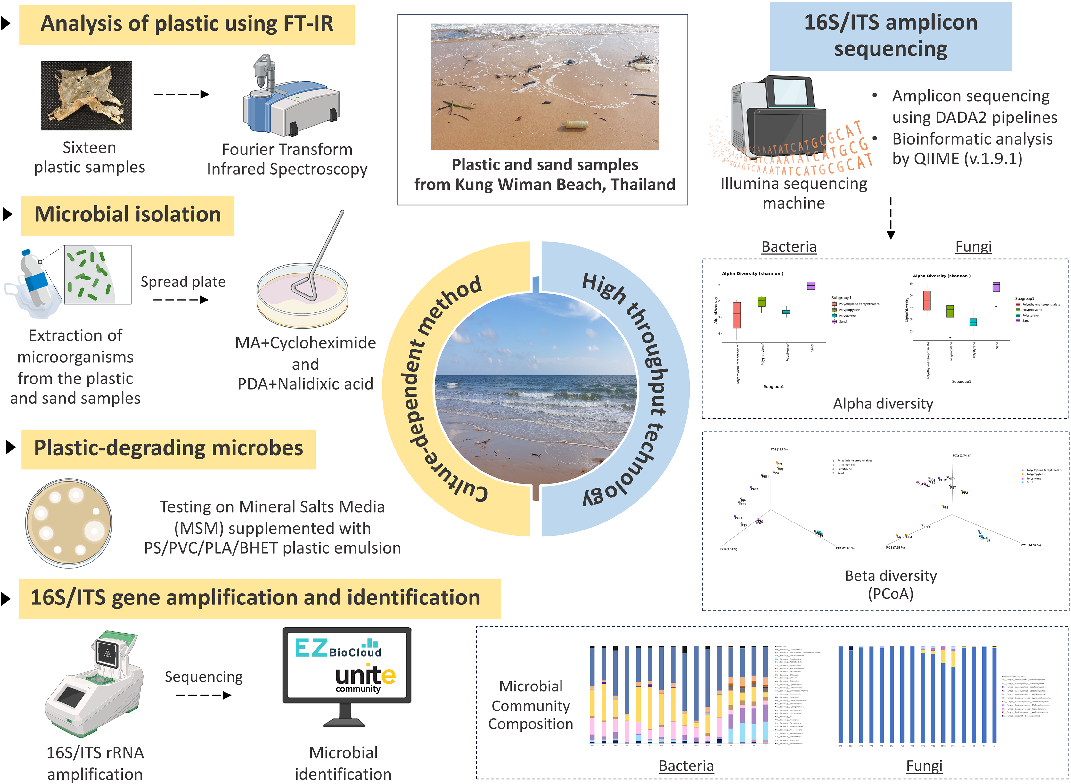
Experimental design schematic for the comparative study of plastisphere microbial communities at Kung Wiman beach, created with BioRender to illustrate the sampling and analysis workflow.
The comparative plastisphere microbial community profile at Kung Wiman beach unveils potential …
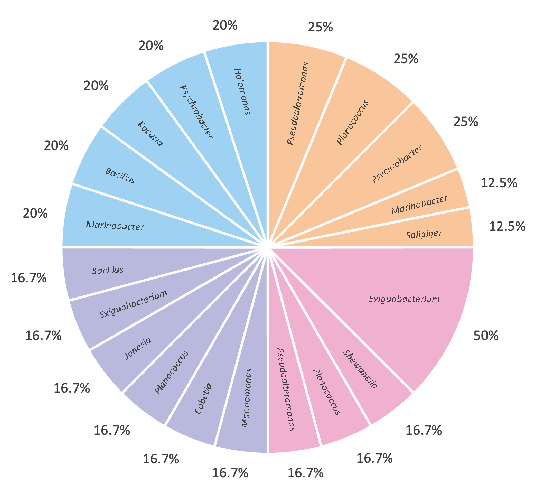
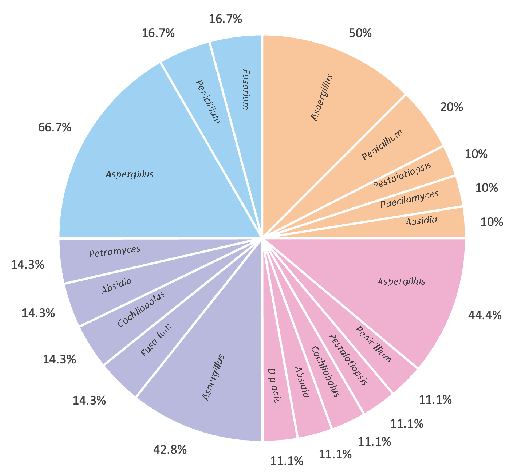
Microbial community analysis data from the comparative plastisphere study at Kung Wiman beach, characterizing microorganisms colonizing plastic debris in the marine environment.
The comparative plastisphere microbial community profile at Kung Wiman beach unveils potential …
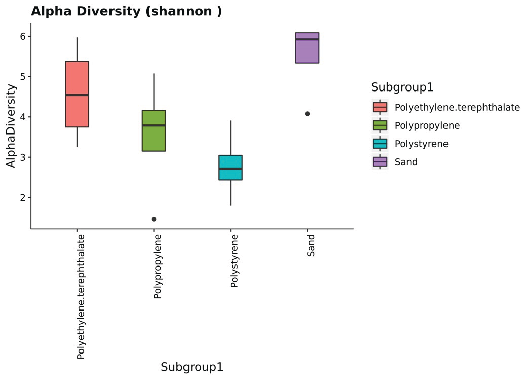
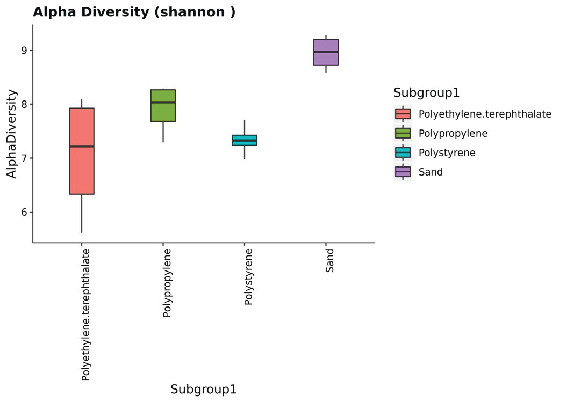
Shannon diversity indices representing alpha diversity of microbial isolates from plastisphere communities at Kung Wiman beach, comparing diversity across different plastic substrate types.
The comparative plastisphere microbial community profile at Kung Wiman beach unveils potential …
Microbial community analysis data from the comparative plastisphere study at Kung Wiman beach, characterizing microorganisms colonizing plastic debris in the marine environment.
The comparative plastisphere microbial community profile at Kung Wiman beach unveils potential …
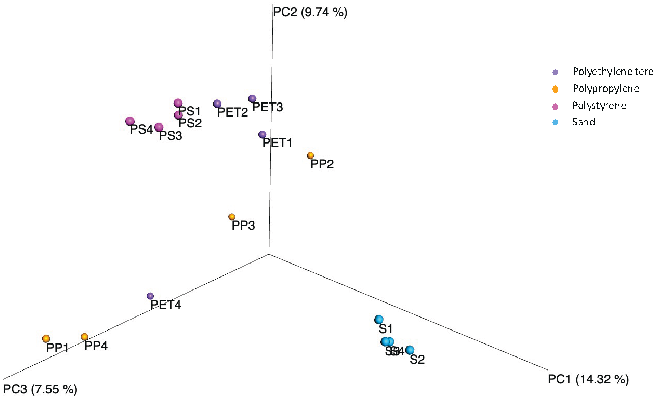
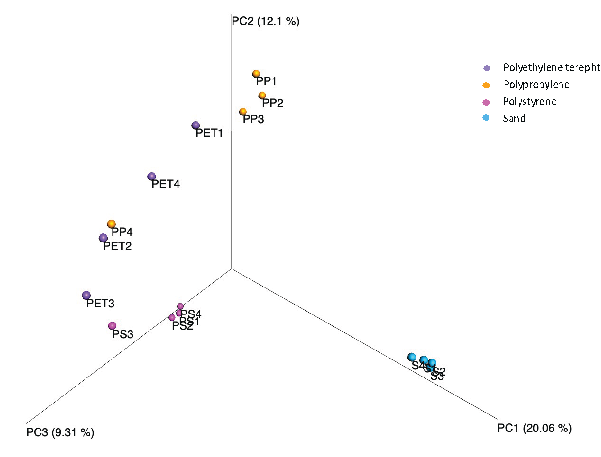
Principal coordinate analysis (PCoA) based on Bray-Curtis dissimilarities, comparing plastisphere microbial community composition across different plastic substrates collected from Kung Wiman beach.
The comparative plastisphere microbial community profile at Kung Wiman beach unveils potential …
Microbial community analysis data from the comparative plastisphere study at Kung Wiman beach, characterizing microorganisms colonizing plastic debris in the marine environment.
The comparative plastisphere microbial community profile at Kung Wiman beach unveils potential …
Microbial community analysis data from the comparative plastisphere study at Kung Wiman beach, characterizing microorganisms colonizing plastic debris in the marine environment.
The comparative plastisphere microbial community profile at Kung Wiman beach unveils potential …