Research Figures
81 figures from peer-reviewed research
Standardized Extract of Valeriana officinalis Improves Overall Sleep Quality in Human Subjects …
Standardized Extract of Valeriana officinalis Improves Overall Sleep Quality in Human Subjects …
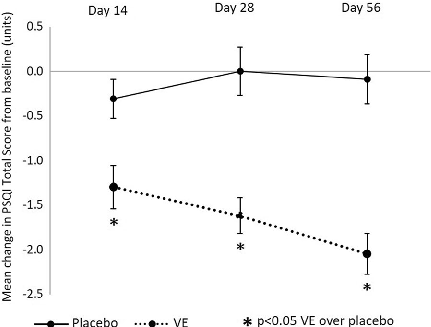
Fig. 3 Summary results of placebo versus VE mean change from baseline in PSQI total score (units)
Standardized Extract of Valeriana officinalis Improves Overall Sleep Quality in Human Subjects …
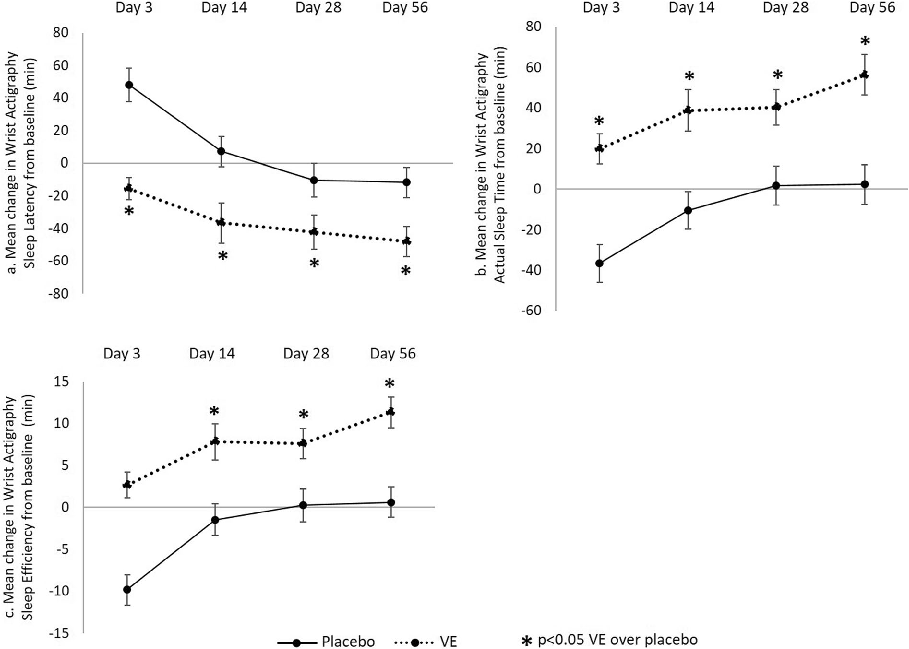
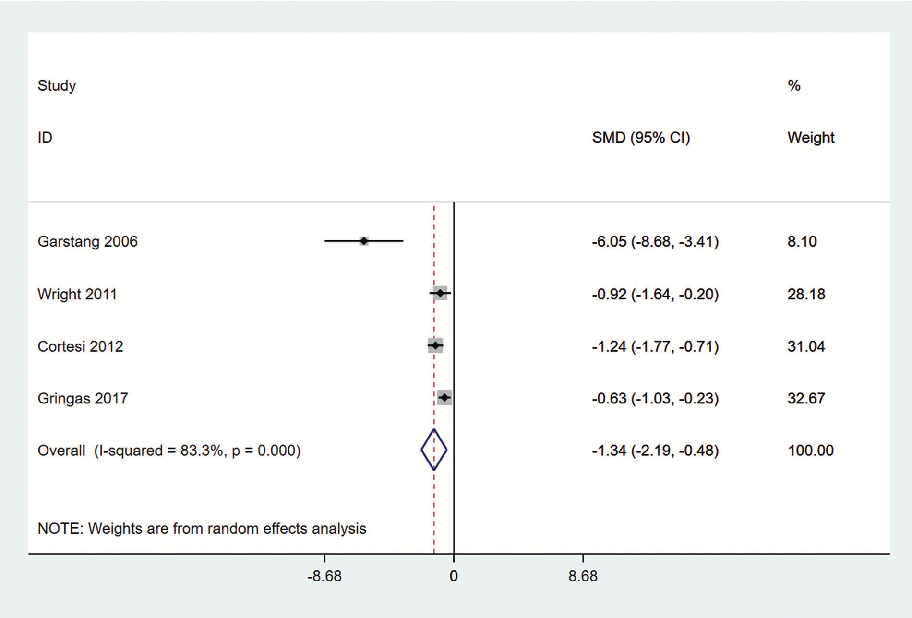
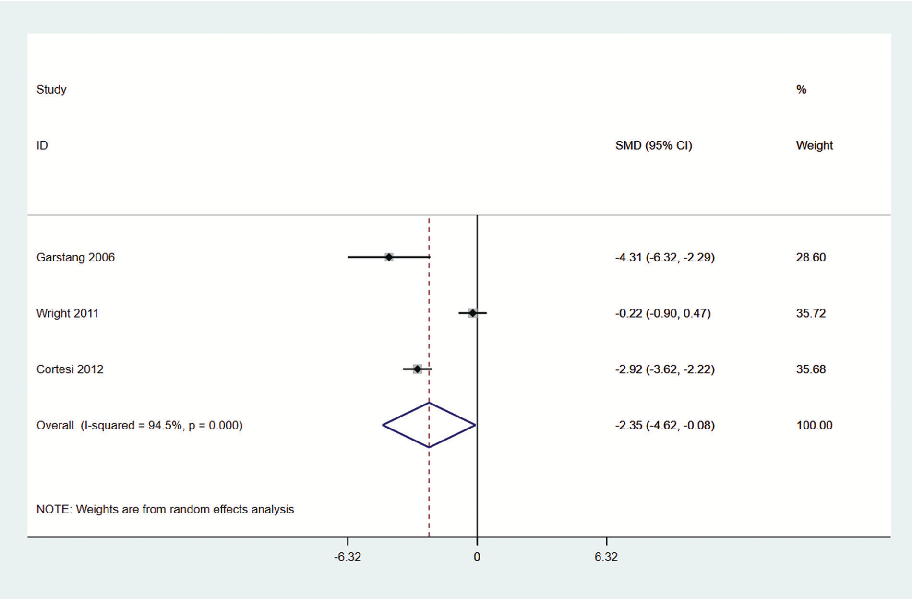
Fig. 4 Summary results of placebo versus VE mean change from baseline by wrist actigraphy in: a sleep latency (min); b actual sleep time (min); and c sleep efficiency (min)
Standardized Extract of Valeriana officinalis Improves Overall Sleep Quality in Human Subjects …
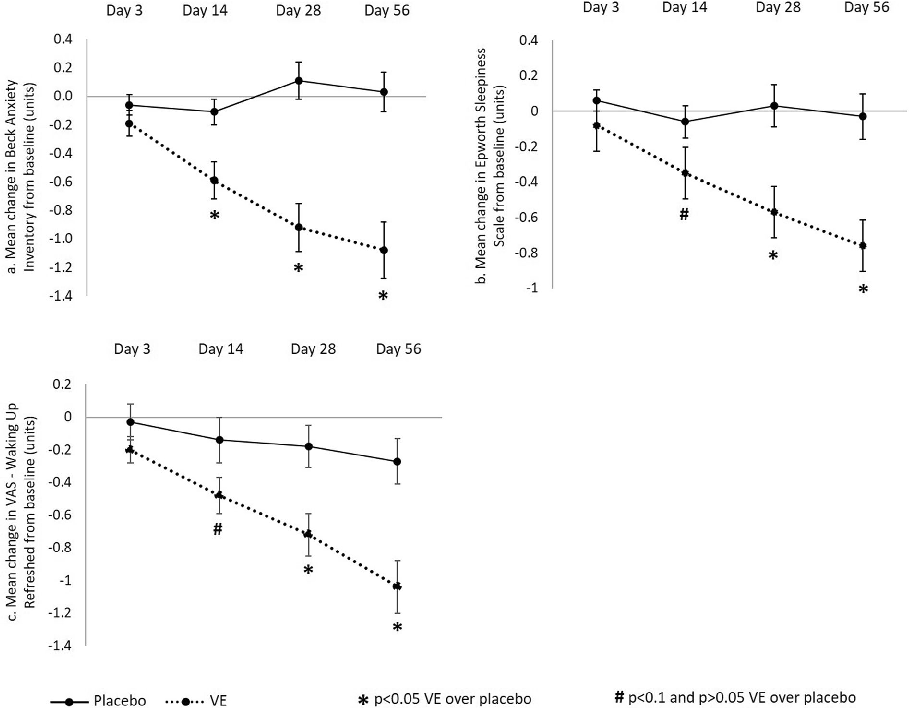
Fig. 5 Summary results of placebo versus VE mean change from baseline in: a Beck Anxiety Inventory (units); b Epworth Sleepiness Scale (units); and c VAS waking up refreshed (units)
Standardized Extract of Valeriana officinalis Improves Overall Sleep Quality in Human Subjects …
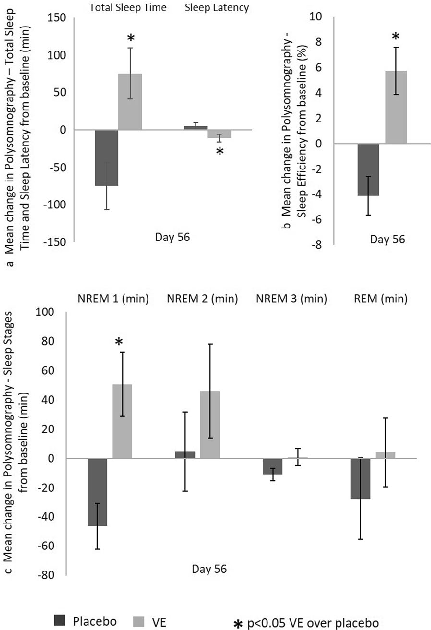
Fig. 6 Summary of placebo versus VE PSG results. Mean change from baseline in: a total sleep time and sleep latency (min); b sleep efficiency (%); and c sleep stages …
Standardized Extract of Valeriana officinalis Improves Overall Sleep Quality in Human Subjects …
Interventions for insomnia in cancer patients and survivors-a comprehensive systematic review and …
Interventions for insomnia in cancer patients and survivors-a comprehensive systematic review and …
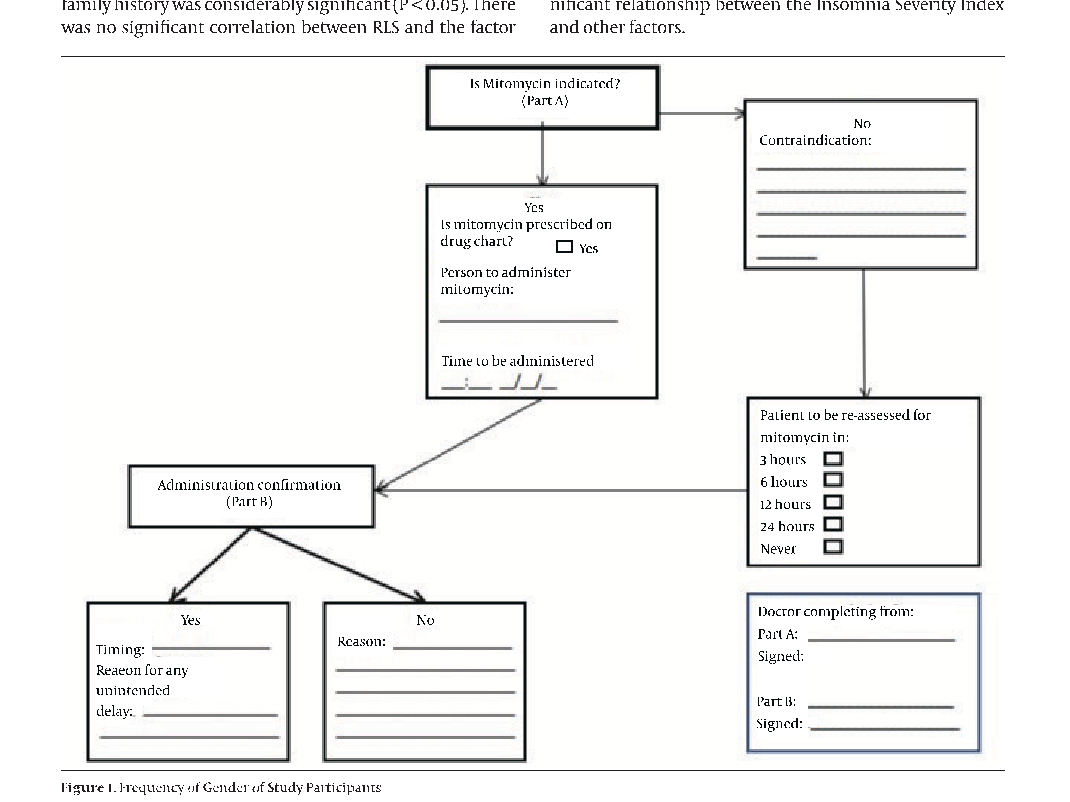
Insomnia and Restless Leg Syndrome in Patients Undergoing Chronic Hemodialysis in Rafsanjan …
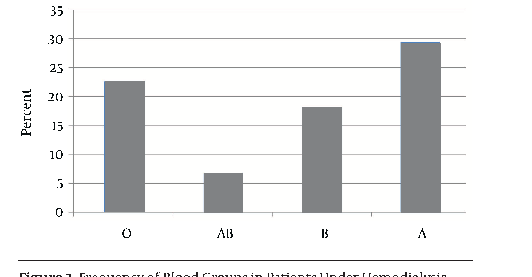
Insomnia and Restless Leg Syndrome in Patients Undergoing Chronic Hemodialysis in Rafsanjan …
Efficacy of Melatonin for Insomnia in Children with Autism Spectrum Disorder: A …
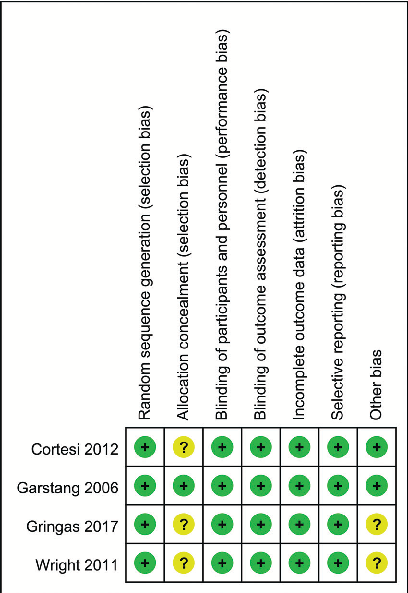
Fig. 2 Risk of bias (RoB) summary: review authors’ judgments about each RoB item for each included study.
Efficacy of Melatonin for Insomnia in Children with Autism Spectrum Disorder: A …
Efficacy of Melatonin for Insomnia in Children with Autism Spectrum Disorder: A …
Efficacy of Melatonin for Insomnia in Children with Autism Spectrum Disorder: A …
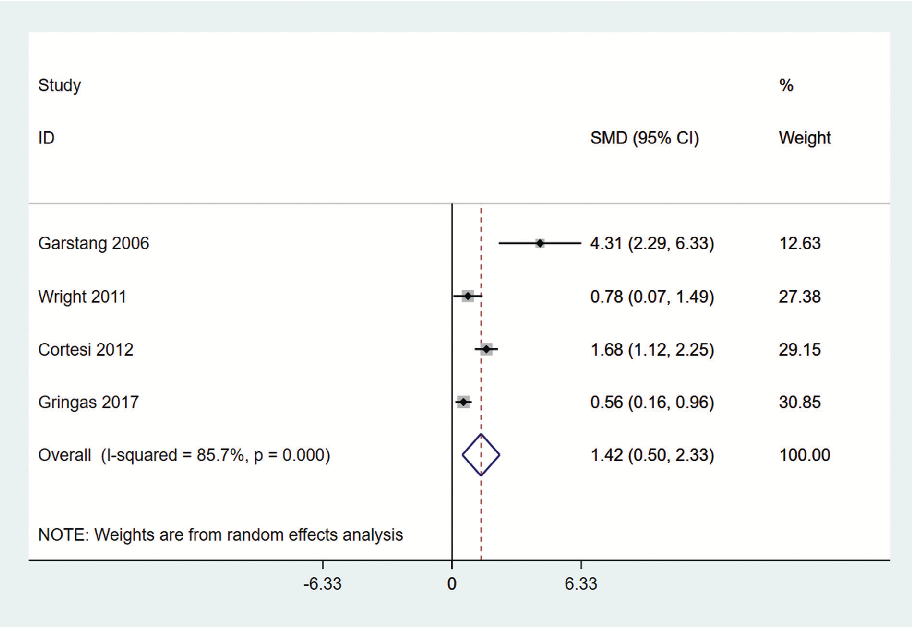
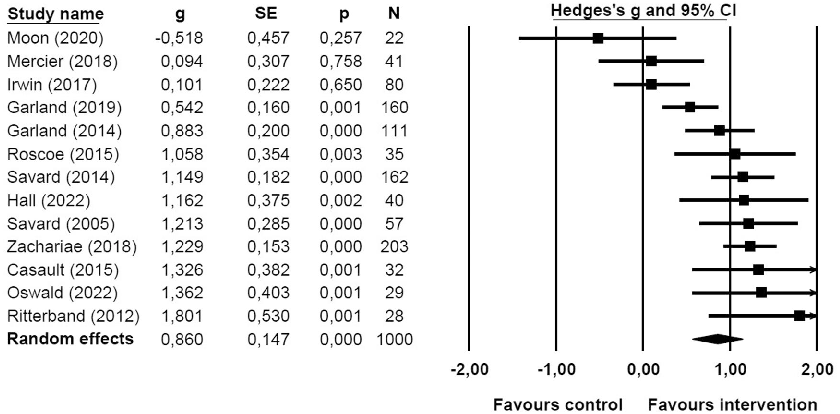
Fig. 5 Forest plot comparing efficacy of melatonin over control in total sleep time in children with ASD. ASD, autism spectrum disorder.
Efficacy of Melatonin for Insomnia in Children with Autism Spectrum Disorder: A …

Sleep-promoting activity of amylase-treated Ashwagandha (Withania somnifera L. Dunal) root extract via …
Sleep-promoting activity of amylase-treated Ashwagandha (Withania somnifera L. Dunal) root extract via …
Sleep-promoting activity of amylase-treated Ashwagandha (Withania somnifera L. Dunal) root extract via …
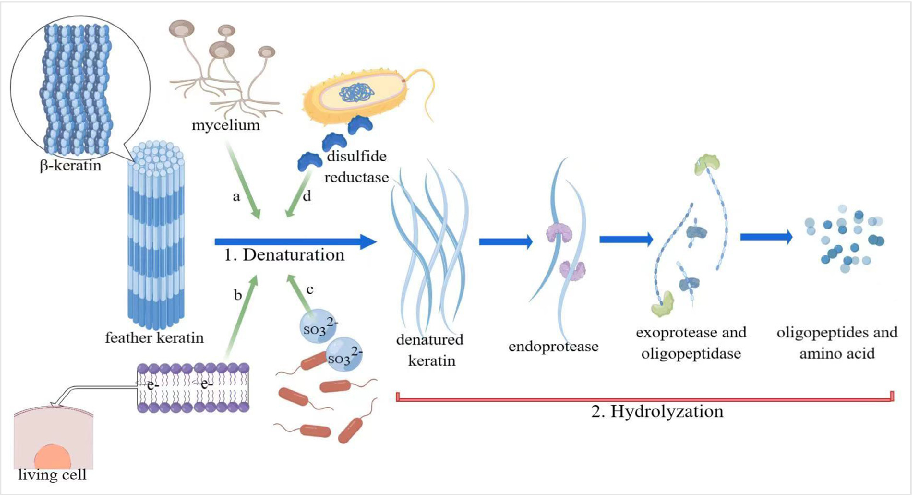
Figure. 1. Its shows the degradation mechanism of feather keratin. The feather keratin is a type of b-keratin and has a lot of disulfide bonds. There are 2 steps in …
Molecular strategies to enhance the keratinase gene expression and its potential implications …
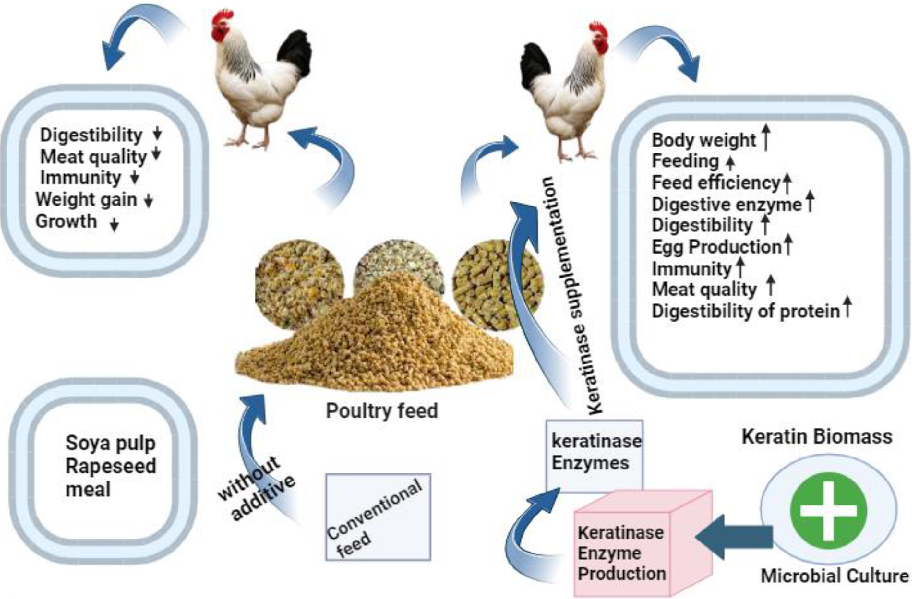
Figure. 2. The efficiency and performance in poultry compared with traditional and keratinase supplemented diet.
Molecular strategies to enhance the keratinase gene expression and its potential implications …
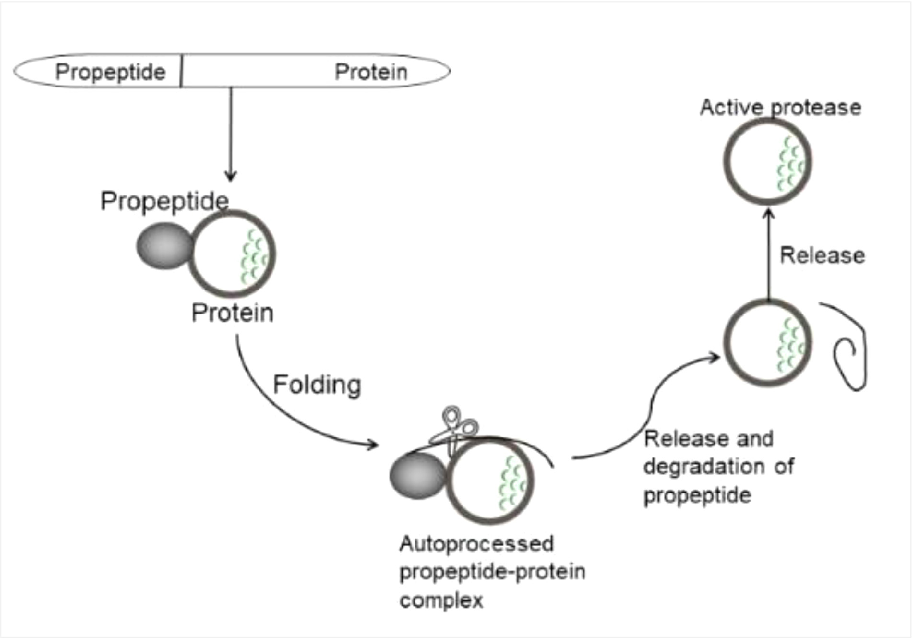
Figure. 3. Propeptide assisted folding pathway. The expression of keratinase can be increased by accelerating the process of enzyme maturation by altering specific locations of the prepeptide, which in turn …
Molecular strategies to enhance the keratinase gene expression and its potential implications …
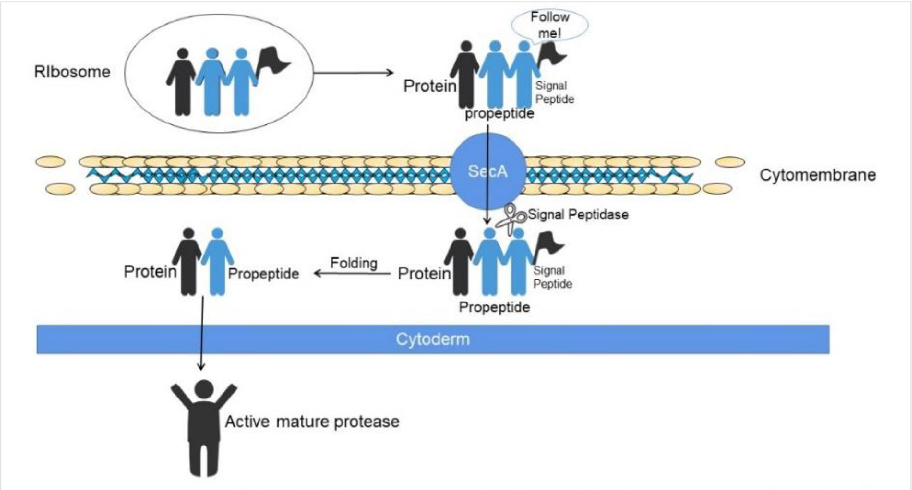
Figure. 4. Mechanism of synthesis & secretion of keratinase by Bacillus subtilis.
Molecular strategies to enhance the keratinase gene expression and its potential implications …
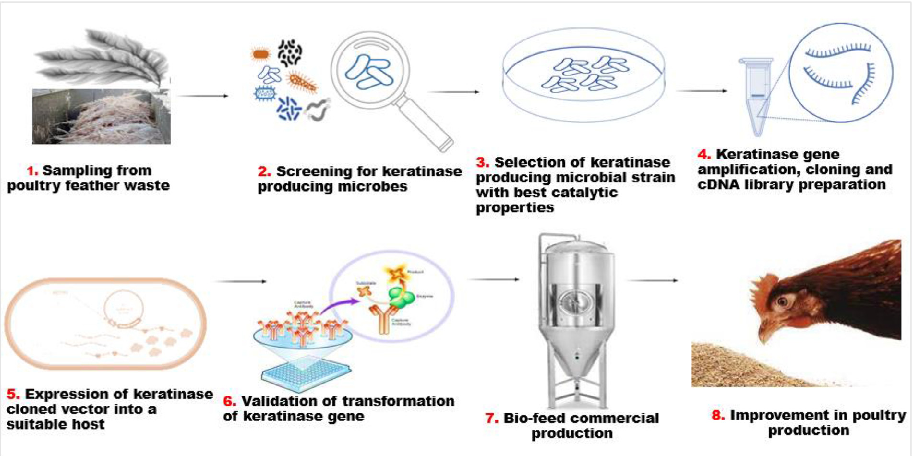
Figure 5. The main steps for producing keratinase in a different organism.
Molecular strategies to enhance the keratinase gene expression and its potential implications …
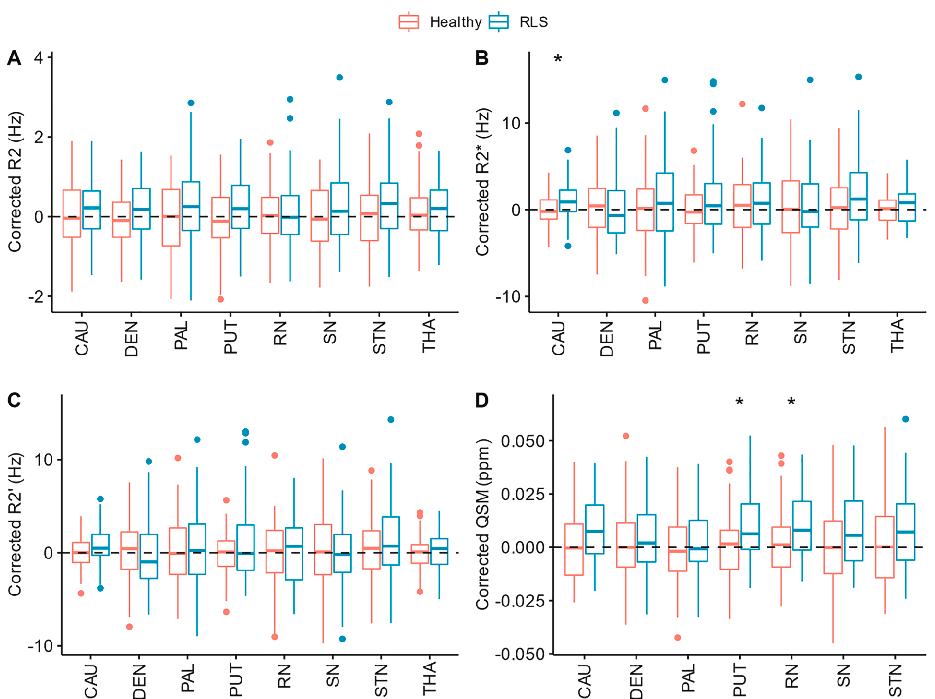
Fig. 1. Regional (A) R2, (B) R2*, (C) R2′ and (D) QSM values corrected for age and volume for healthy controls (blue) and RLS patients (red). CAU: Caudate, DEN: Dentate …
Revisiting brain iron deficiency in restless legs syndrome using magnetic resonance imaging.
Page 1 of 4