Araştırma Süreci
153 hakemli araştırmalardan görseller
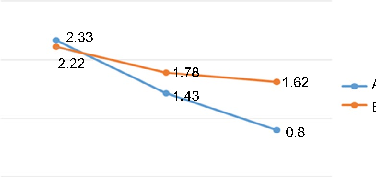
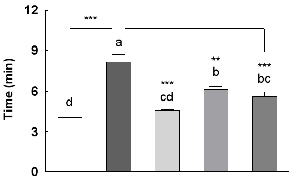
Number of night awakenings (average)
Evaluation of effectiveness and safety of a herbal compound in primary insomnia …
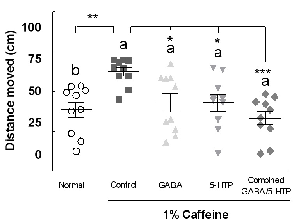
Two combined amino acids promote sleep activity in caffeine-induced sleepless model systems.
Two combined amino acids promote sleep activity in caffeine-induced sleepless model systems.
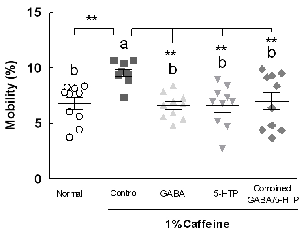
Two combined amino acids promote sleep activity in caffeine-induced sleepless model systems.
Two combined amino acids promote sleep activity in caffeine-induced sleepless model systems.
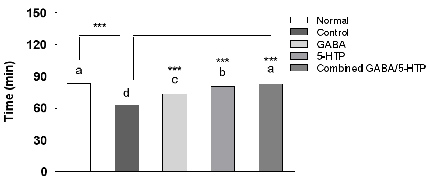
Group Dose (mg/kg) Caffeine (mg/kg) No. falling sleep/total Sleep onset (%) Sleep duration (min) Normal 0 0 6/13 46.15 29.72 ± 2.13a Control 0 10 6/15 40.00 16.40 ± 0.49c …
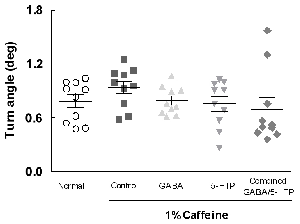
Two combined amino acids promote sleep activity in caffeine-induced sleepless model systems.
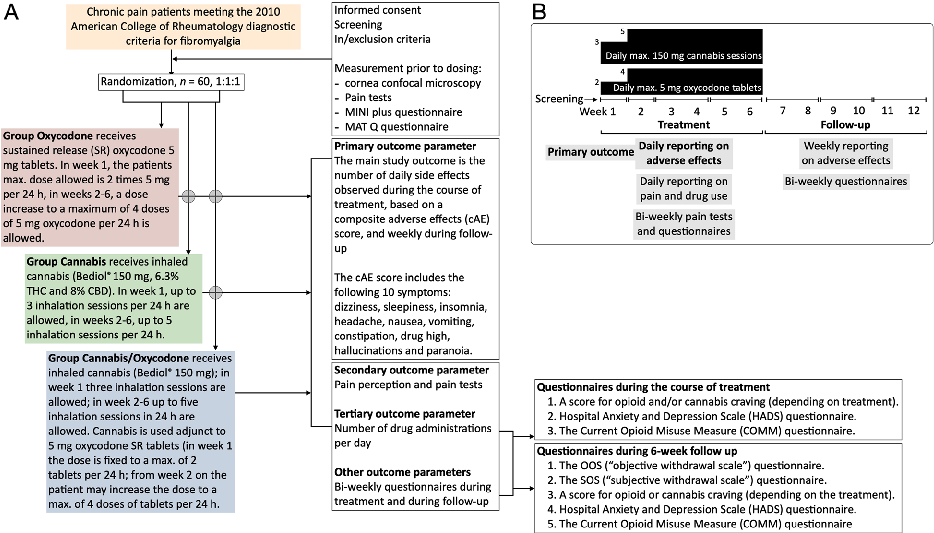
The study procedures flow diagram and dosing schedule illustrate participant progression through the open-label trial with randomization between cannabis, oxycodone, and combination arms.
Cannabis-opioid interaction in the treatment of fibromyalgia pain: an open-label, proof of …
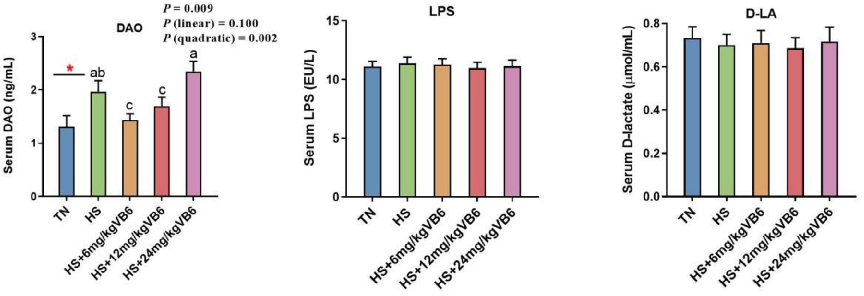
Dietary vitamin B6 supplementation alleviates heat stress-induced intestinal barrier impairment by regulating …
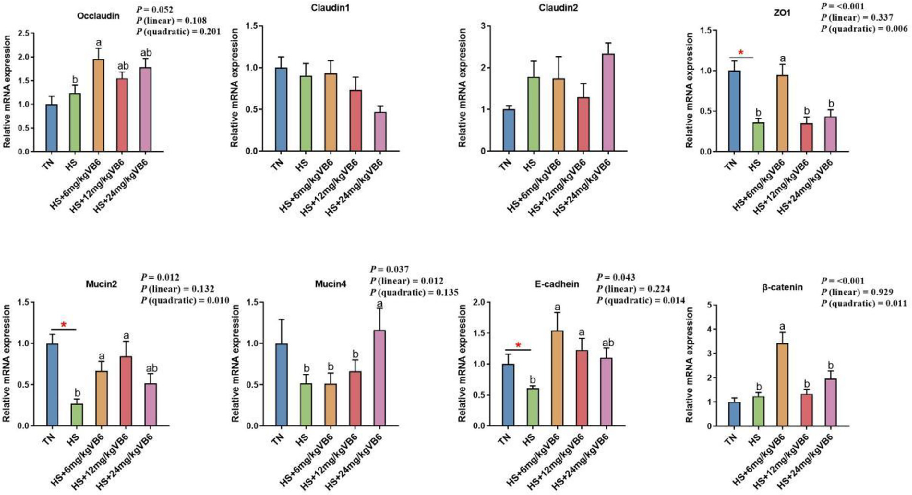
Figure 3. Effect of vitamin B6 on the mRNA expression of intestinal barrier function of heat-stressed broilers. Data are presented as mean § SEM (n = 10). Mean values of …
Dietary vitamin B6 supplementation alleviates heat stress-induced intestinal barrier impairment by regulating …
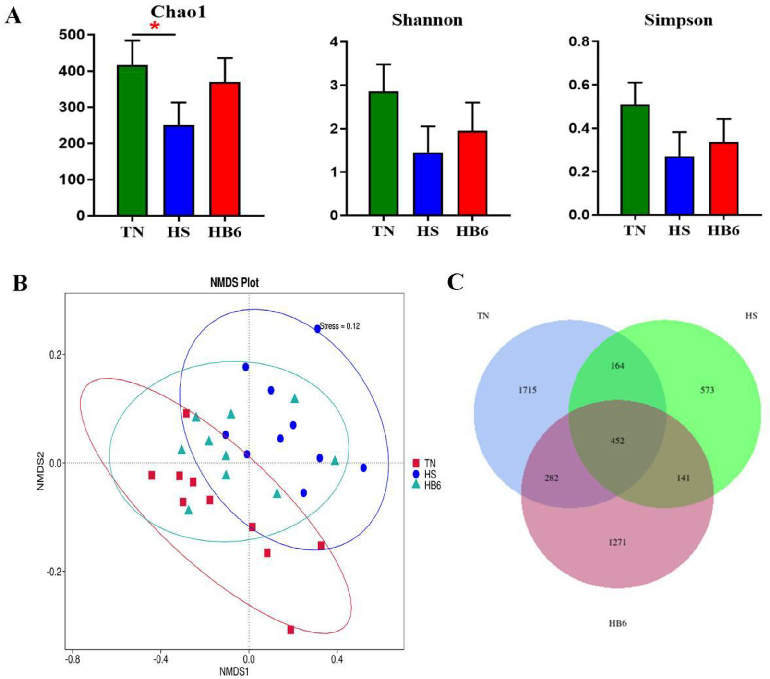
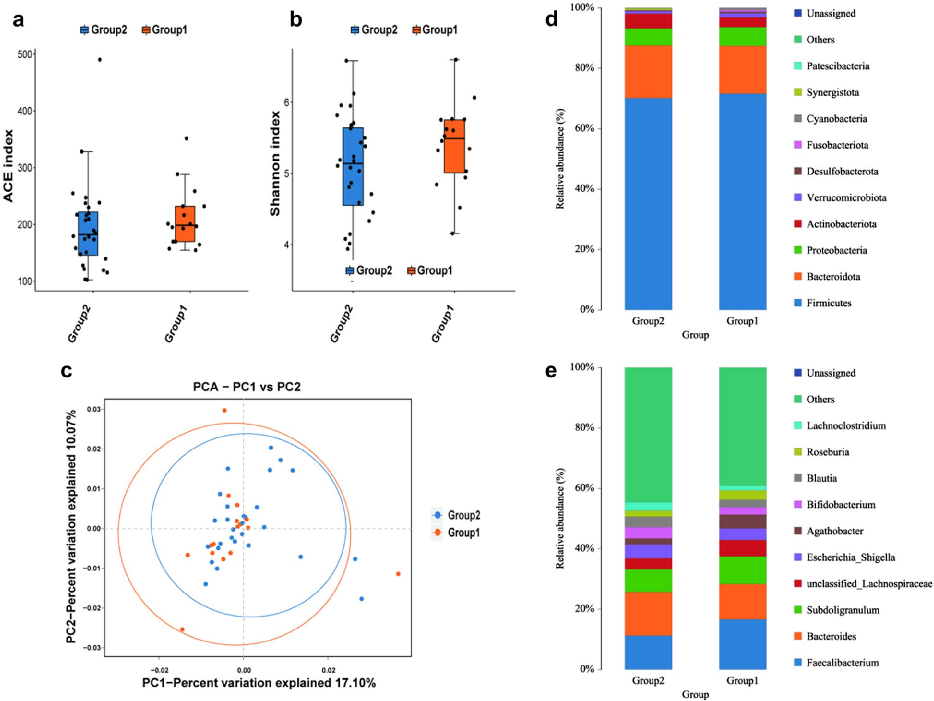
Figure 4. Effect of vitamin B6 on the composition of gut microbiota in the ileum mucosa of heat-stressed broilers. (A) a diversity indices (Chao1, Shannon, Simpson). (B) Non-metric multidimensional scaling …
Dietary vitamin B6 supplementation alleviates heat stress-induced intestinal barrier impairment by regulating …
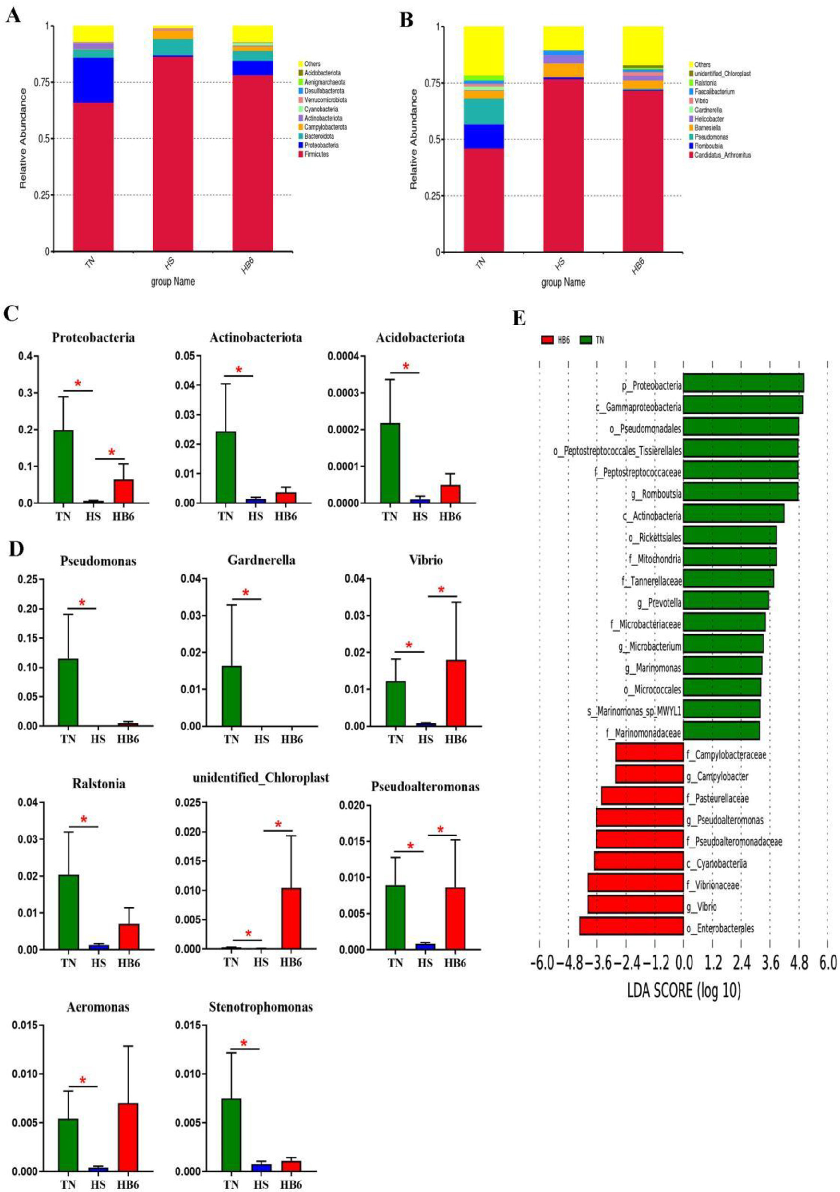
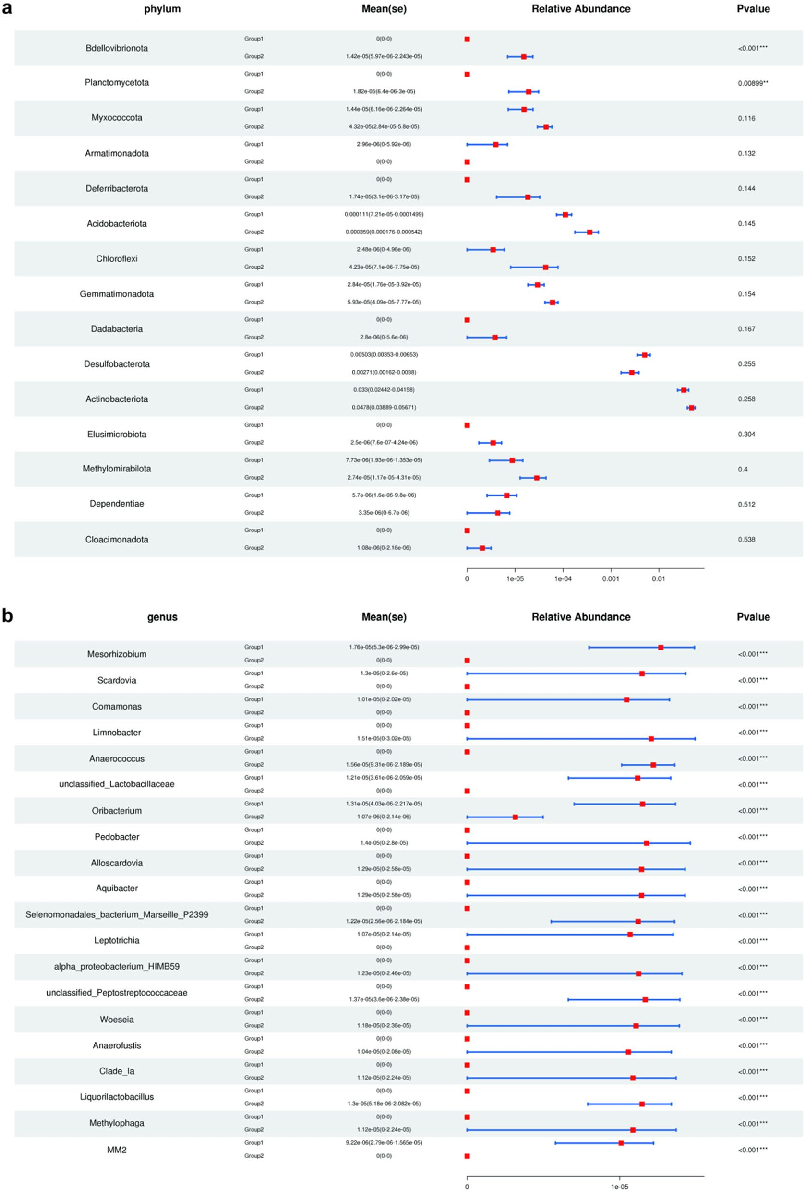
Figure 5. Differences in the bacterial communities of ileum mucosa determined by LEfSe analysis and MetaStat analysis. (A) The microbial community at the phylum level. (B) The microbial community at …
Dietary vitamin B6 supplementation alleviates heat stress-induced intestinal barrier impairment by regulating …
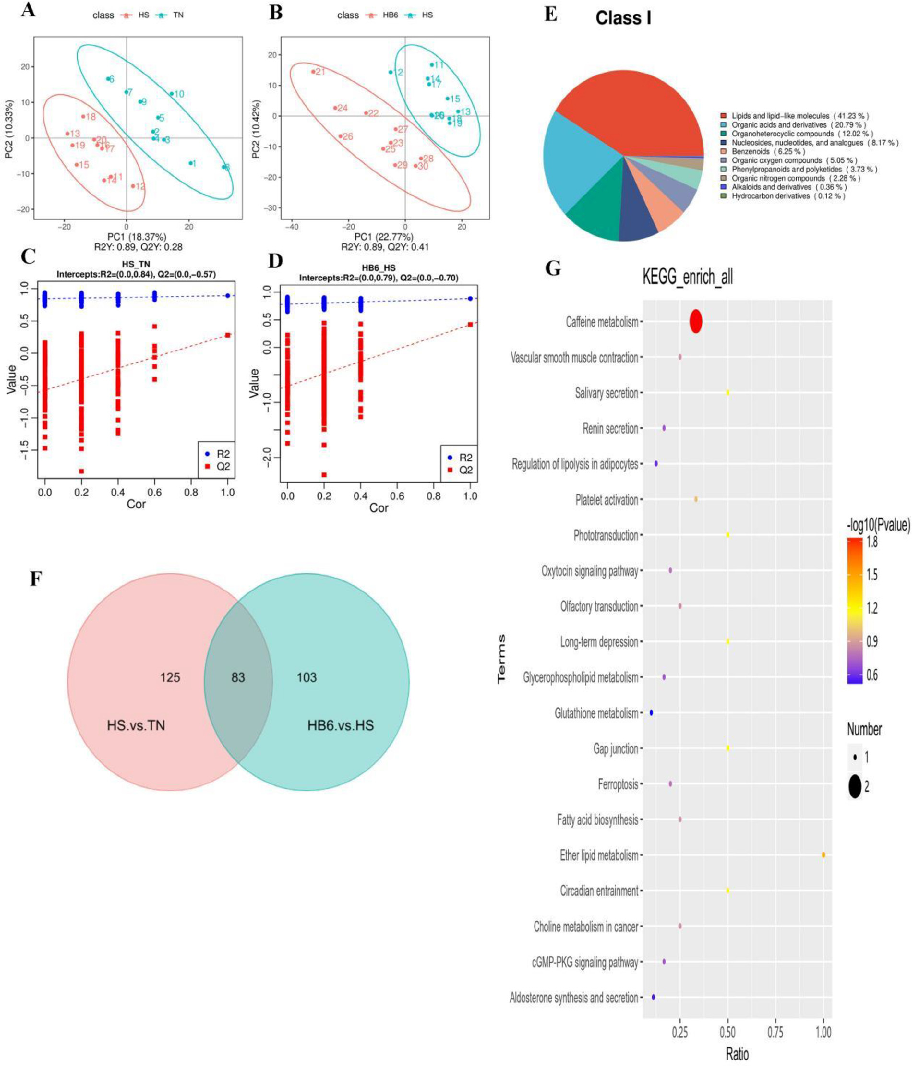
Figure 6. Effect of vitamin B6 on the ileum mucosa metabolites of heat-stressed broilers. (A-B) Partial least squares-discriminant analysis (PLS-DA) score plot. (C-D) PLS-DA valid plot. (E) Pie chart of …
Dietary vitamin B6 supplementation alleviates heat stress-induced intestinal barrier impairment by regulating …
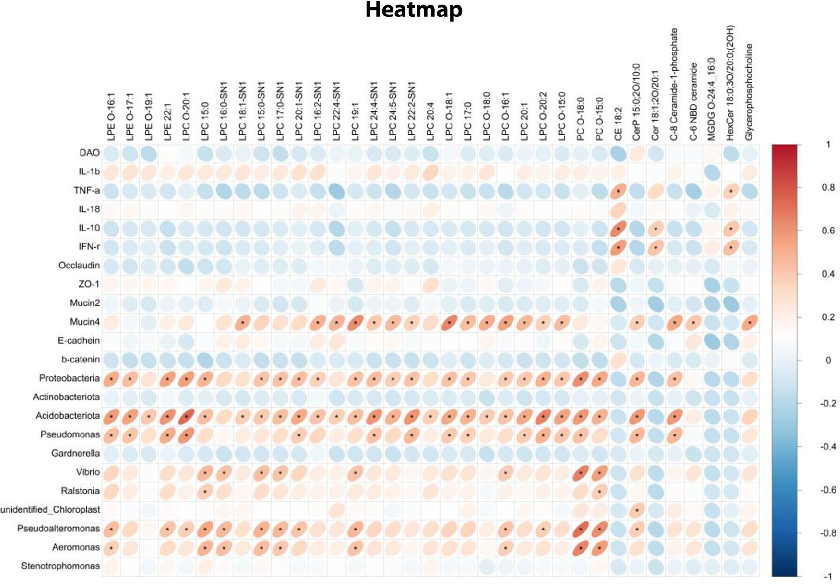
Figure 7. Spearman correlation among ileal differential metabolites with FC > 2, differential microbiota at the phylum and genus levels, differential gut barrier parameters and inflammatory cytokines. The red circle …
Dietary vitamin B6 supplementation alleviates heat stress-induced intestinal barrier impairment by regulating …
Study on gut microbiota and metabolomics in postmenopausal women.
Study on gut microbiota and metabolomics in postmenopausal women.
Study on gut microbiota and metabolomics in postmenopausal women.
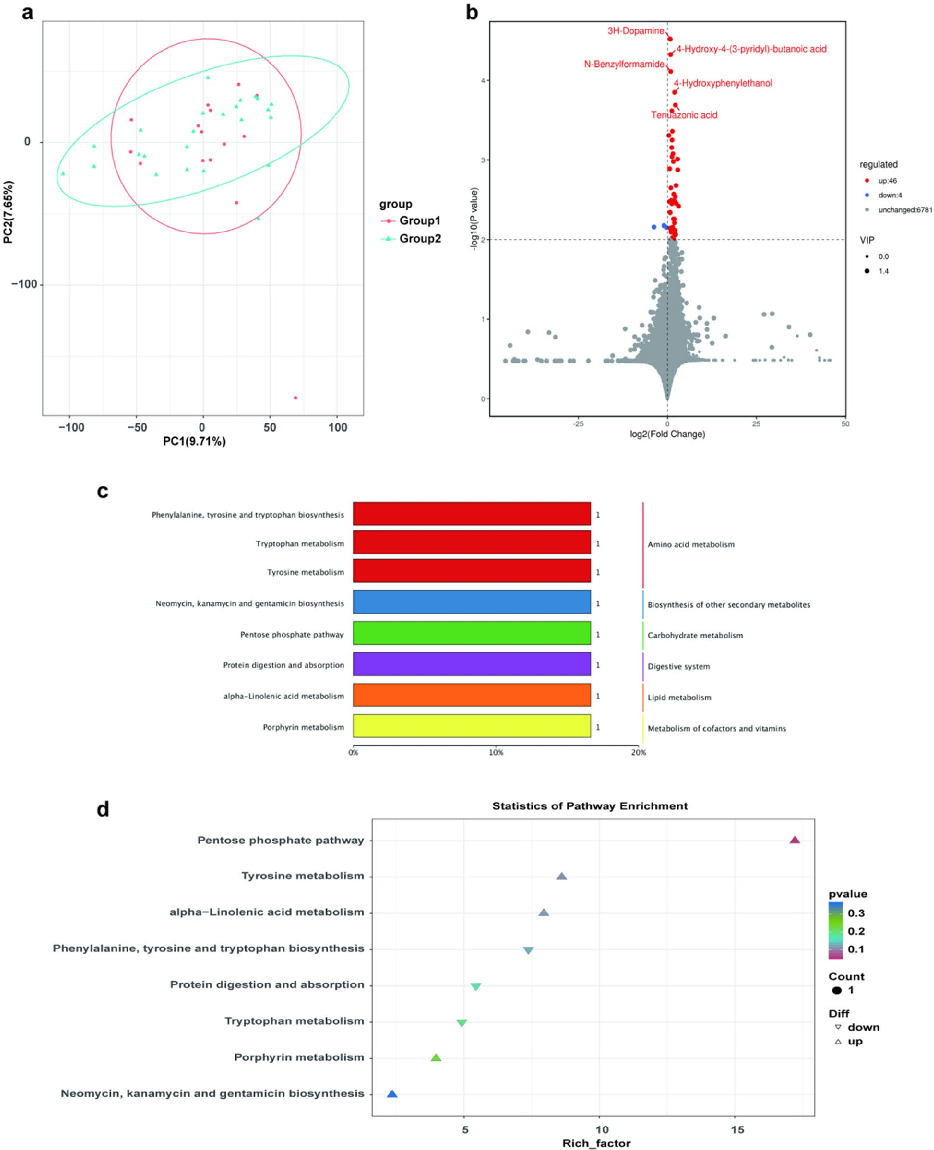
Study on gut microbiota and metabolomics in postmenopausal women.
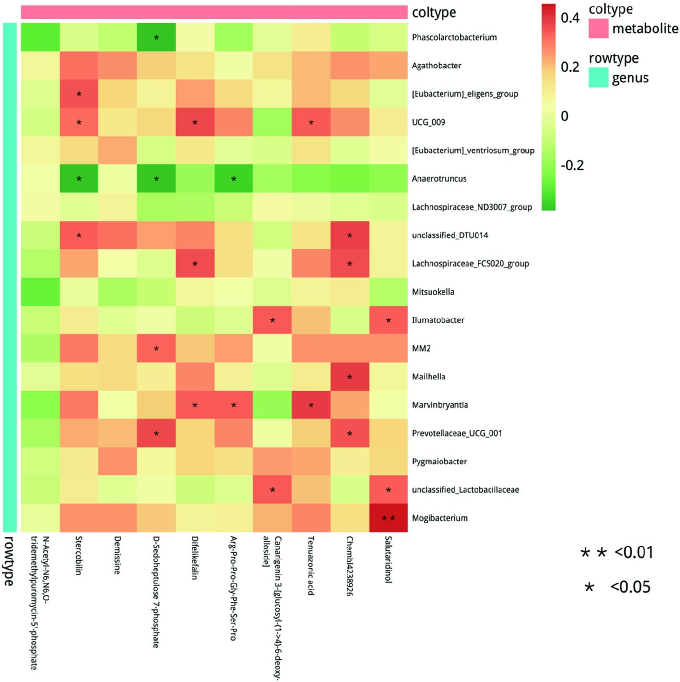
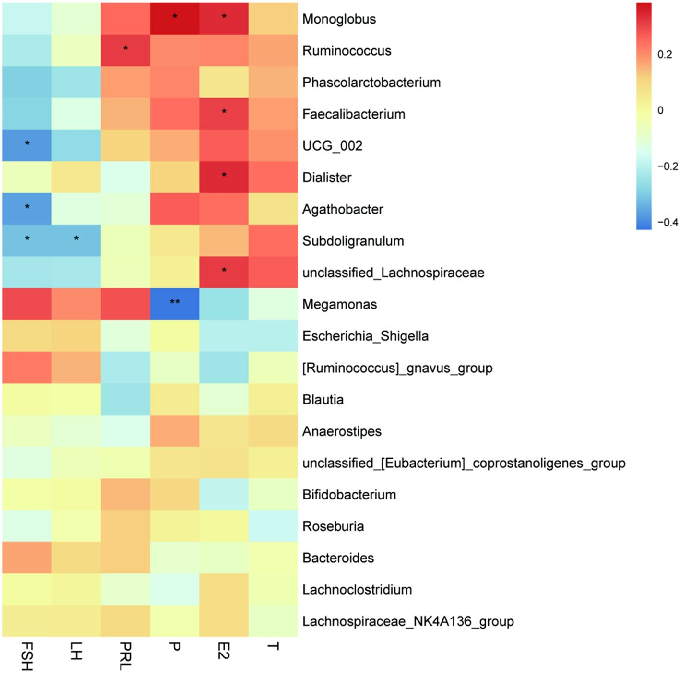
Fig. 5 The relationship between gut microbiota and gut metabolism, with red and yellow indicating positive correlation and green indicating negative correlation. The significance of the chart is represented as …
Study on gut microbiota and metabolomics in postmenopausal women.
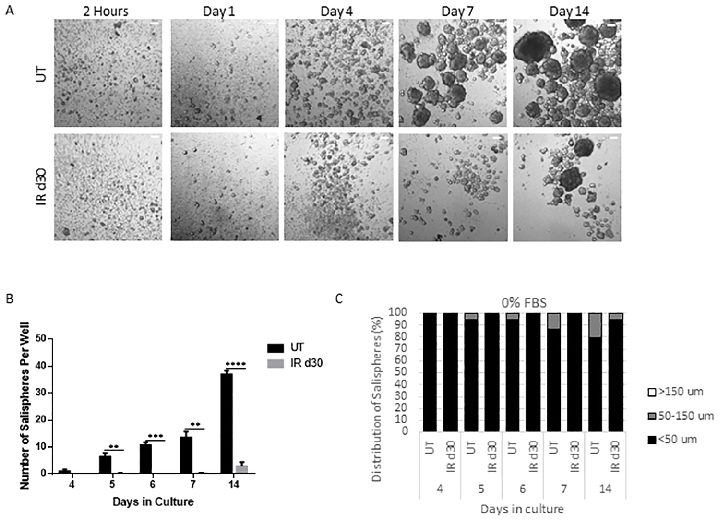
Sphere-forming efficiency of parotid-derived cells decreases significantly following a single 5 Gy radiation dose, quantified at day 30 post-irradiation.
Administration of growth factors promotes salisphere formation from irradiated parotid salivary glands.
Proliferation rates of salisphere cultures from untreated and irradiated parotid glands are compared under serum-free conditions, showing similar growth kinetics despite radiation damage.
Administration of growth factors promotes salisphere formation from irradiated parotid salivary glands.
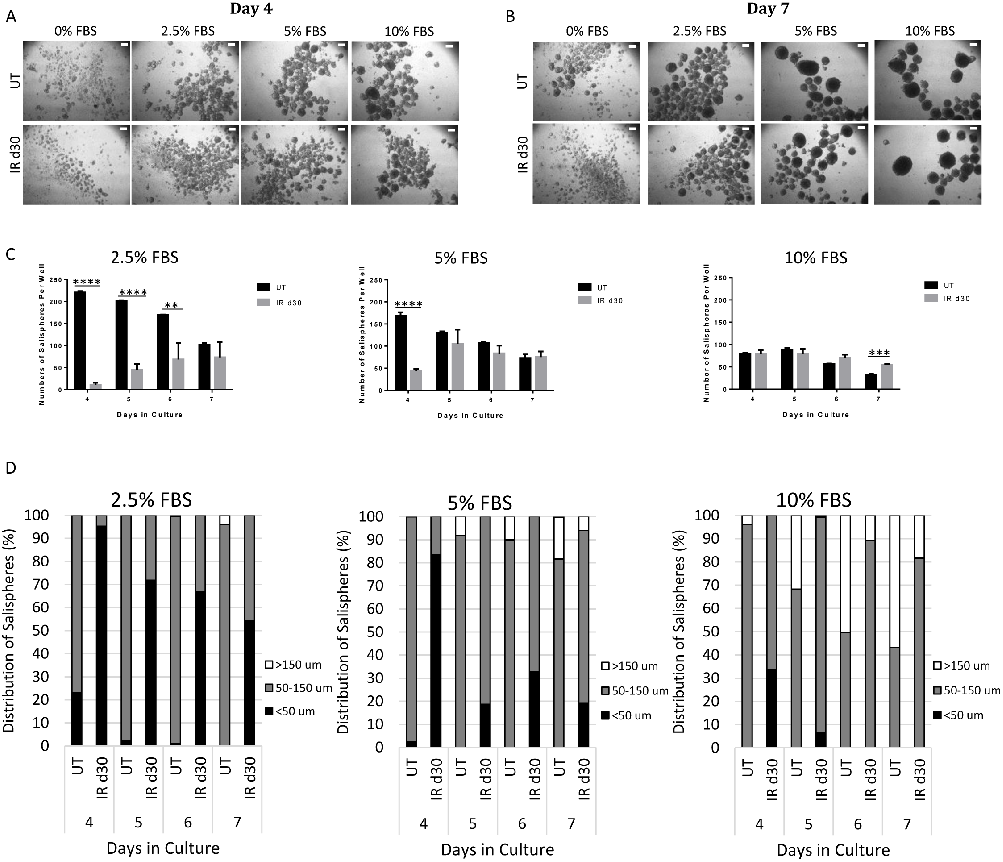
Fetal bovine serum supplementation increases the sphere-forming efficiency of irradiated parotid-derived cells, as shown by representative bright-field microscopy images and quantification.
Administration of growth factors promotes salisphere formation from irradiated parotid salivary glands.
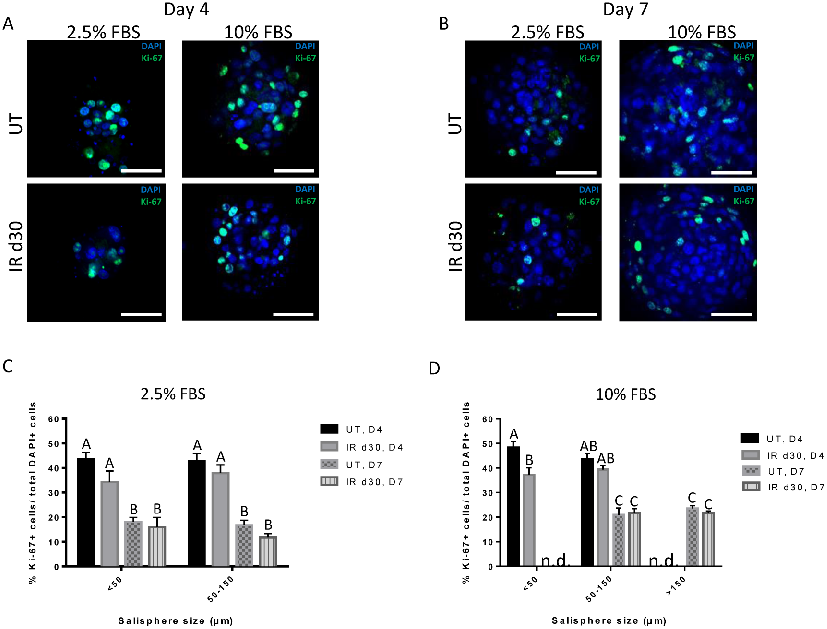
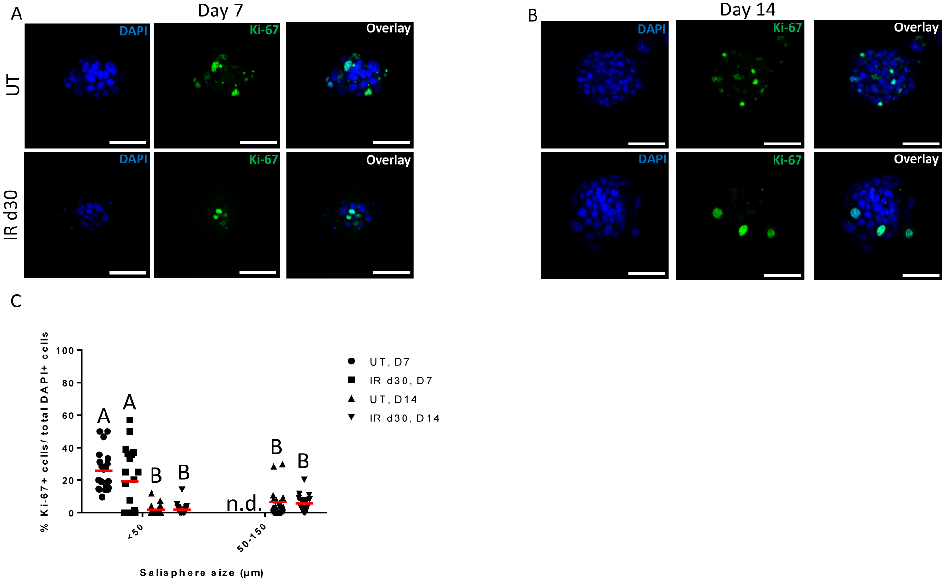
Proliferation assays confirm comparable growth rates between untreated and irradiated salisphere cultures supplemented with FBS, indicating that reduced sphere formation is not due to proliferation deficits.
Administration of growth factors promotes salisphere formation from irradiated parotid salivary glands.
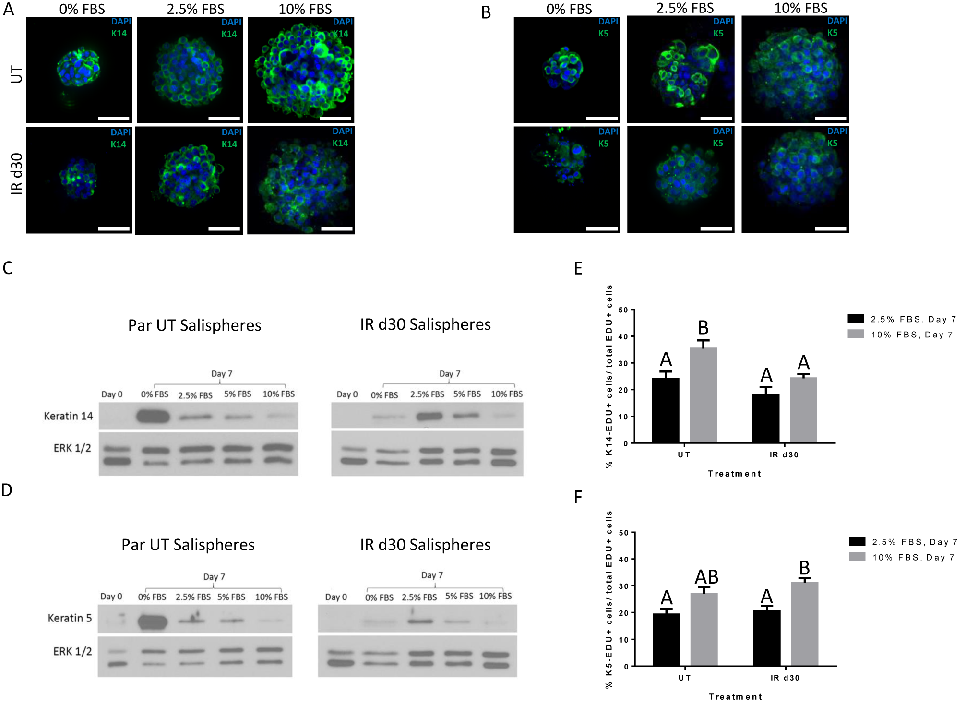
Expression of salivary stem and progenitor cell markers in salisphere cultures demonstrates that both untreated and irradiated cells maintain their progenitor phenotype.
Administration of growth factors promotes salisphere formation from irradiated parotid salivary glands.
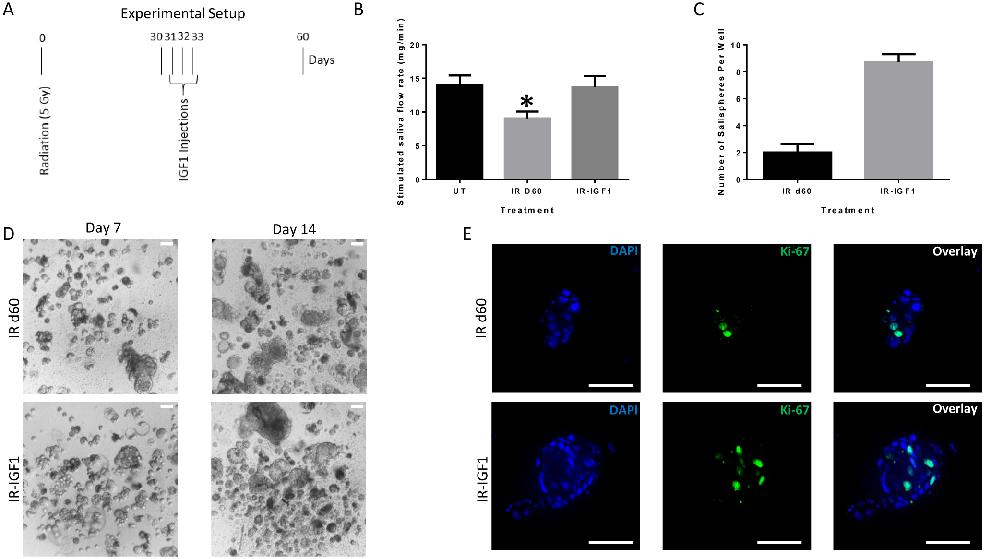
Post-radiation IGF-1 treatment significantly enhances sphere-forming efficiency of irradiated parotid cells, suggesting growth factor administration as a strategy to restore salivary function.
Administration of growth factors promotes salisphere formation from irradiated parotid salivary glands.
Sayfa 4 / 7