비타민 B6 그림
31 동료 심사 연구의 그림
Brain imaging studies demonstrate that elevated homocysteine is associated with accelerated rates of brain atrophy, particularly in medial temporal lobe structures critical for memory. B-vitamin treatment appears to slow this atrophy in individuals with elevated baseline homocysteine.
Homocysteine and Dementia: An International Consensus Statement.
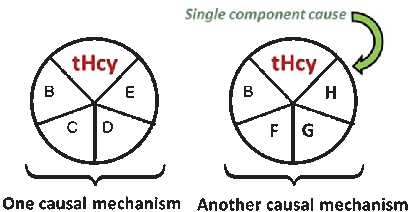
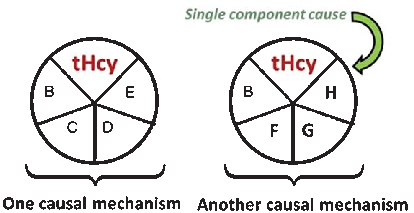
A causal model illustrates how elevated plasma homocysteine may contribute to dementia through multiple pathways, interacting with other risk factors such as age, hypercholesterolemia, and genetic predisposition. No single factor is sufficient alone; rather, combinations of component causes drive disease.
Homocysteine and Dementia: An International Consensus Statement.
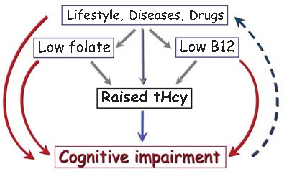
Meta-analyses of cohort studies consistently indicate that elevated homocysteine is associated with approximately doubled risk of Alzheimer's disease. The strength of this association persists after adjustment for common confounders including age, sex, and education.
Homocysteine and Dementia: An International Consensus Statement.
![Figure 1. One-carbon metabolism. Abbreviations: PLP, plasma pyridoxal phosphate; MTHFR, methylenetetrahydrofolate reductase; FAD, flavin adenine dinucleotide; FMN, flavin mononucleotide. Adapted from [16].](https://pdfs.citedhealth.com/figures/27854316/97.png)
One-carbon metabolism pathways involving folate, vitamin B12, and vitamin B6 are mapped, showing key enzymatic reactions catalyzed by MTHFR and the roles of FAD and FMN as cofactors in homocysteine recycling.
Causes, Consequences and Public Health Implications of Low B-Vitamin Status in Ageing.
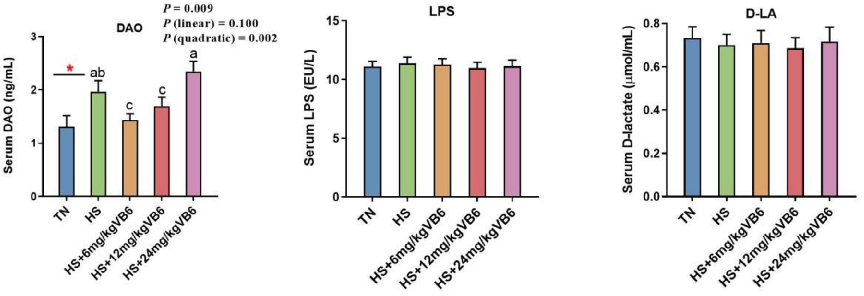
Dietary vitamin B6 supplementation alleviates heat stress-induced intestinal barrier impairment by regulating …
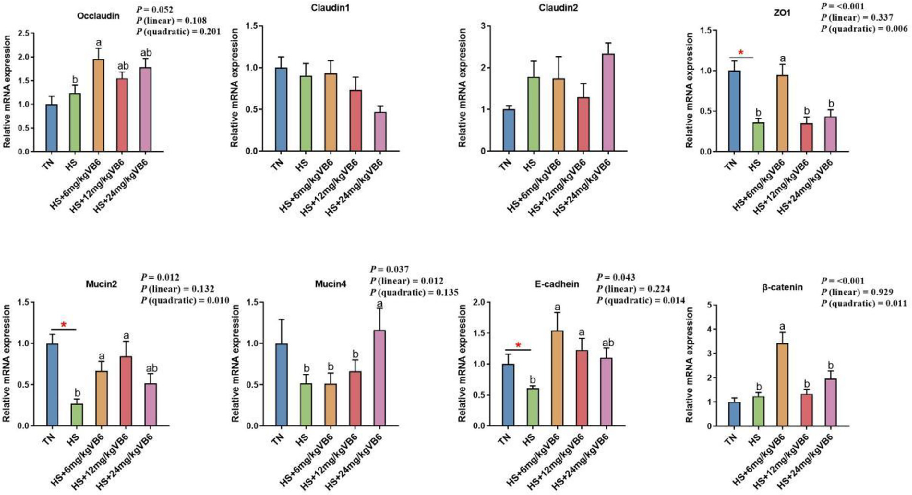
Figure 3. Effect of vitamin B6 on the mRNA expression of intestinal barrier function of heat-stressed broilers. Data are presented as mean § SEM (n = 10). Mean values of …
Dietary vitamin B6 supplementation alleviates heat stress-induced intestinal barrier impairment by regulating …
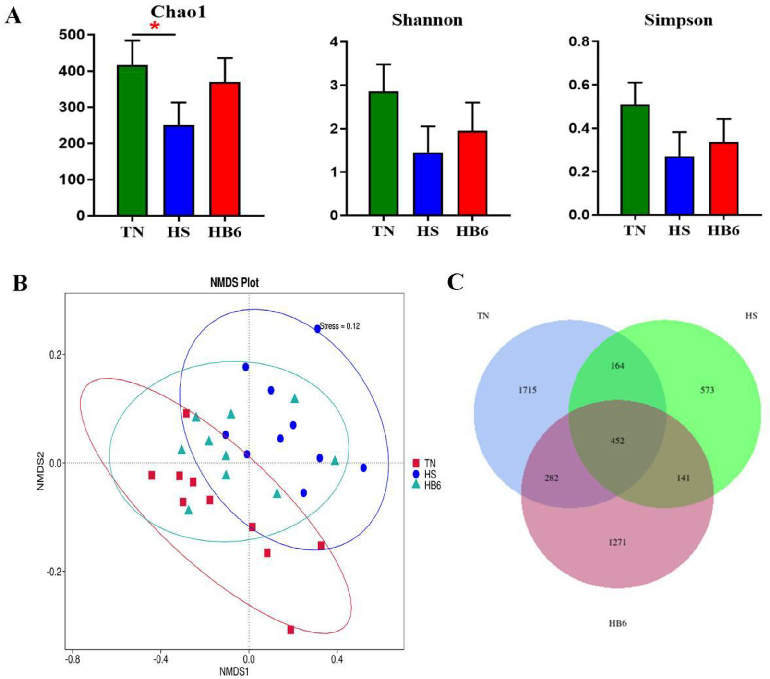
Figure 4. Effect of vitamin B6 on the composition of gut microbiota in the ileum mucosa of heat-stressed broilers. (A) a diversity indices (Chao1, Shannon, Simpson). (B) Non-metric multidimensional scaling …
Dietary vitamin B6 supplementation alleviates heat stress-induced intestinal barrier impairment by regulating …
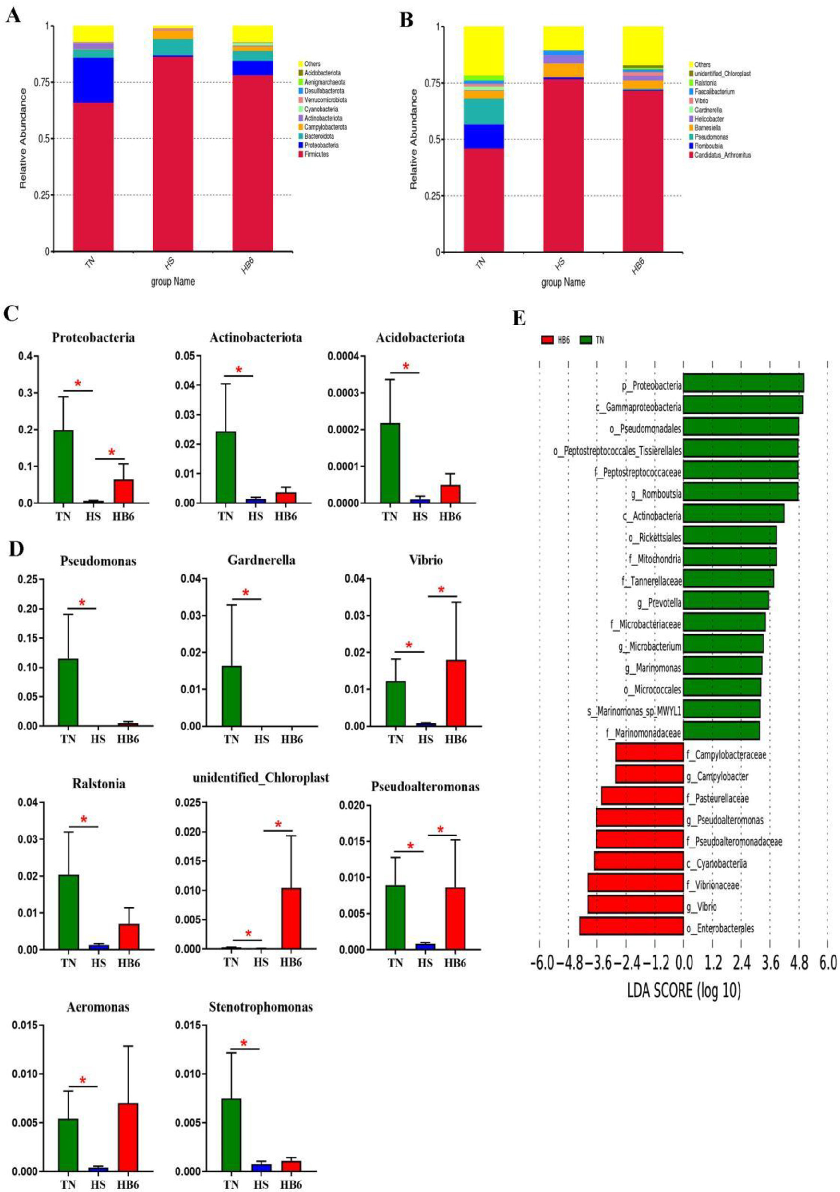
Figure 5. Differences in the bacterial communities of ileum mucosa determined by LEfSe analysis and MetaStat analysis. (A) The microbial community at the phylum level. (B) The microbial community at …
Dietary vitamin B6 supplementation alleviates heat stress-induced intestinal barrier impairment by regulating …
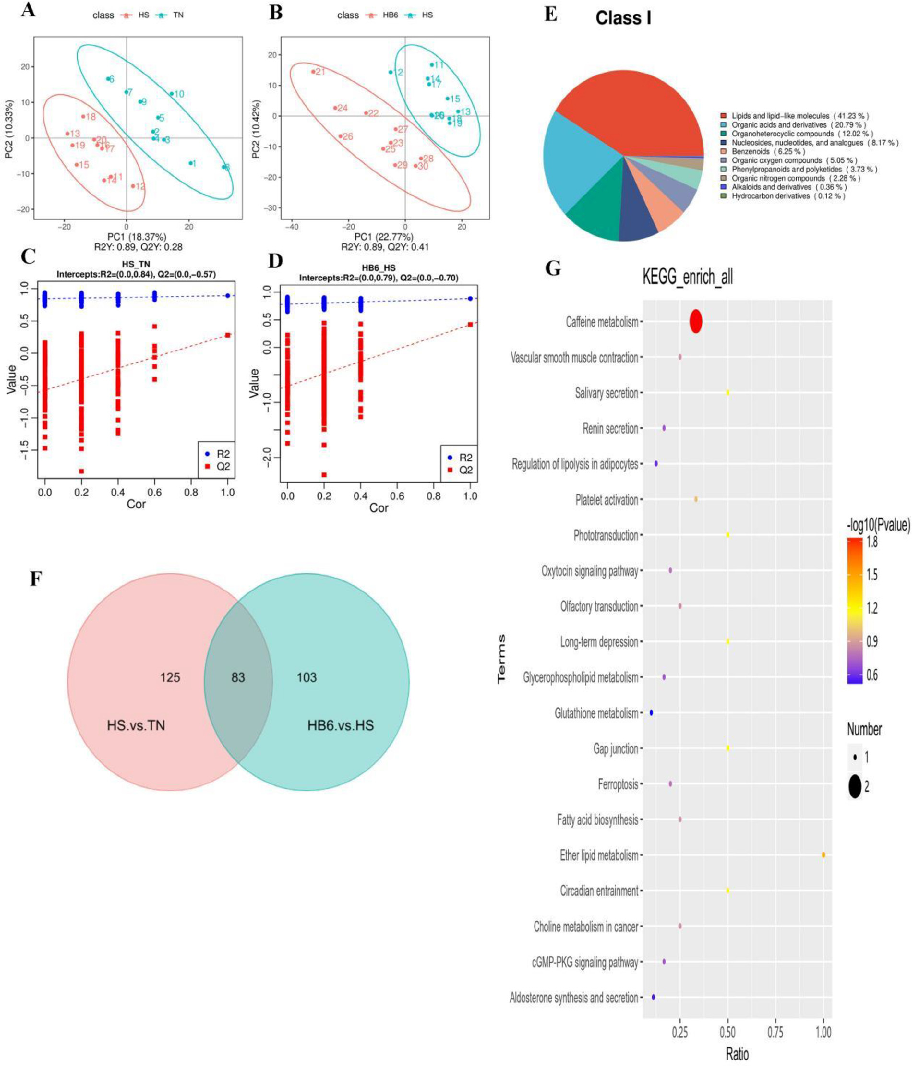
Figure 6. Effect of vitamin B6 on the ileum mucosa metabolites of heat-stressed broilers. (A-B) Partial least squares-discriminant analysis (PLS-DA) score plot. (C-D) PLS-DA valid plot. (E) Pie chart of …
Dietary vitamin B6 supplementation alleviates heat stress-induced intestinal barrier impairment by regulating …
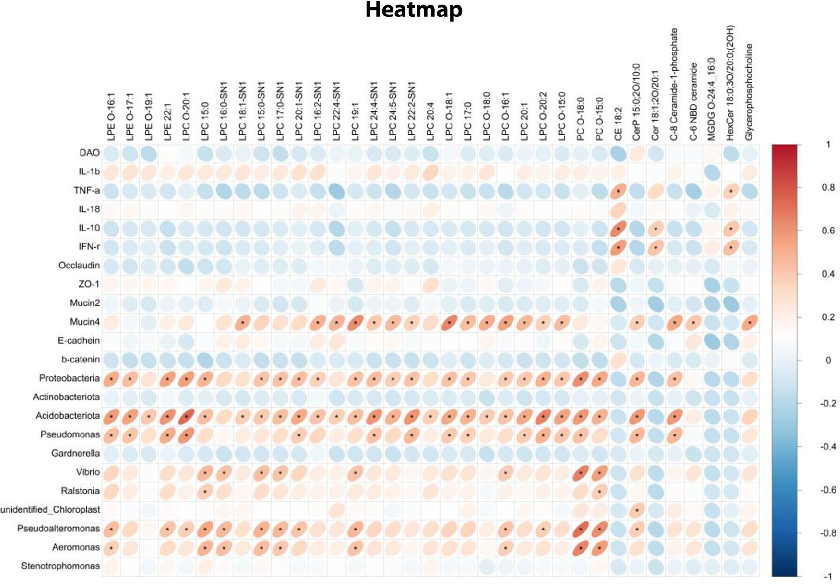
Figure 7. Spearman correlation among ileal differential metabolites with FC > 2, differential microbiota at the phylum and genus levels, differential gut barrier parameters and inflammatory cytokines. The red circle …
Dietary vitamin B6 supplementation alleviates heat stress-induced intestinal barrier impairment by regulating …
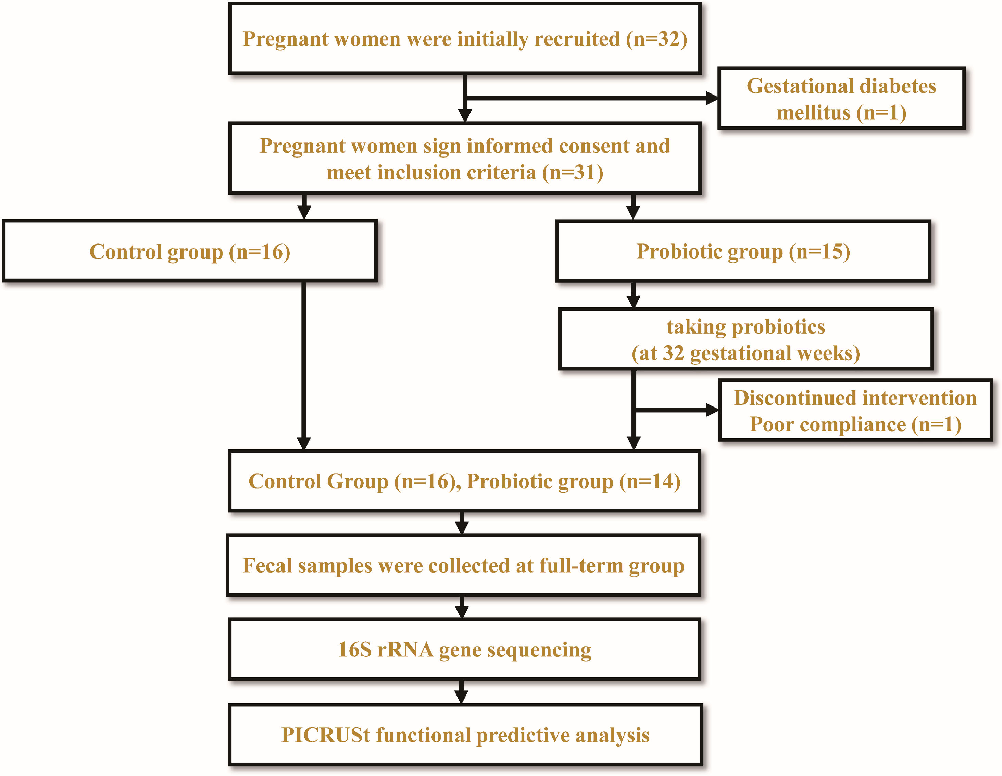
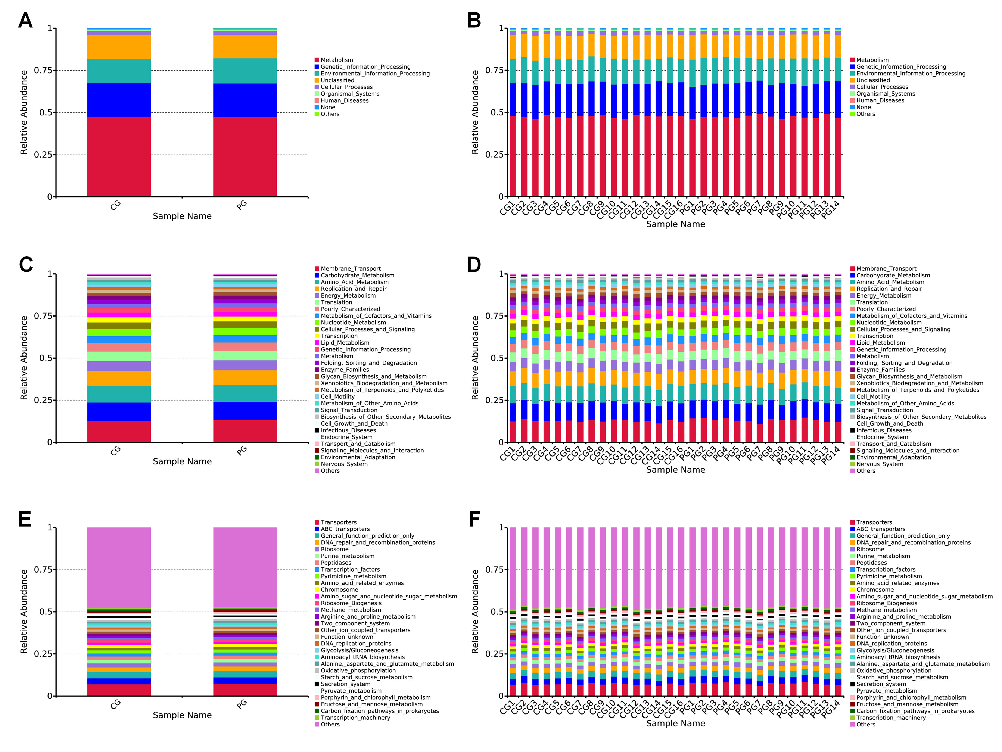
Gut microbiota diversity analysis from pregnant women receiving probiotic supplementation, assessing changes in microbial community composition and functional capacity.
Effect of probiotic administration during pregnancy on the functional diversity of the …
Gut microbiota diversity analysis from pregnant women receiving probiotic supplementation, assessing changes in microbial community composition and functional capacity.
Effect of probiotic administration during pregnancy on the functional diversity of the …
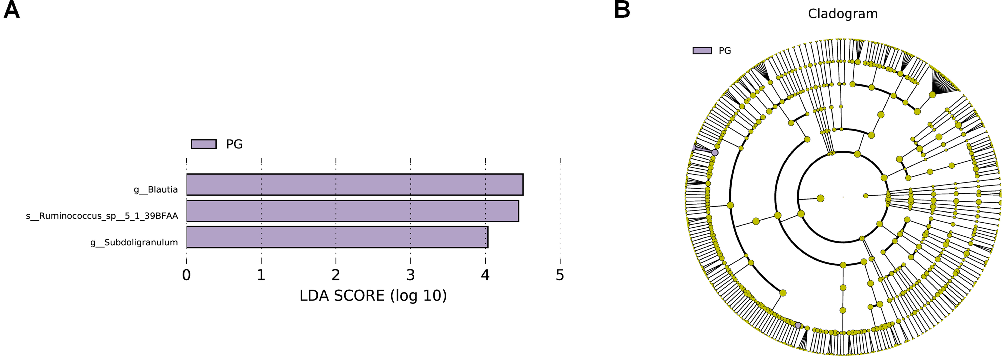
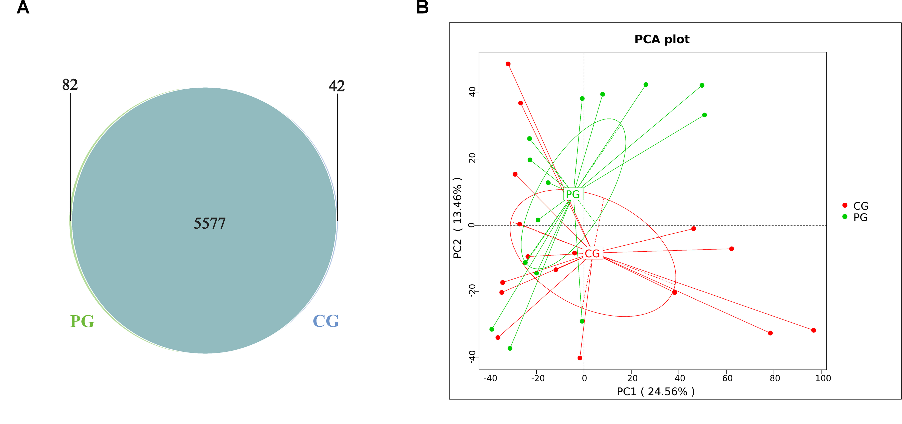
Extended microbiome analysis data from the pregnancy probiotic trial, examining functional diversity shifts in the gut microbiota of mothers and their offspring.
Effect of probiotic administration during pregnancy on the functional diversity of the …
Extended microbiome analysis data from the pregnancy probiotic trial, examining functional diversity shifts in the gut microbiota of mothers and their offspring.
Effect of probiotic administration during pregnancy on the functional diversity of the …
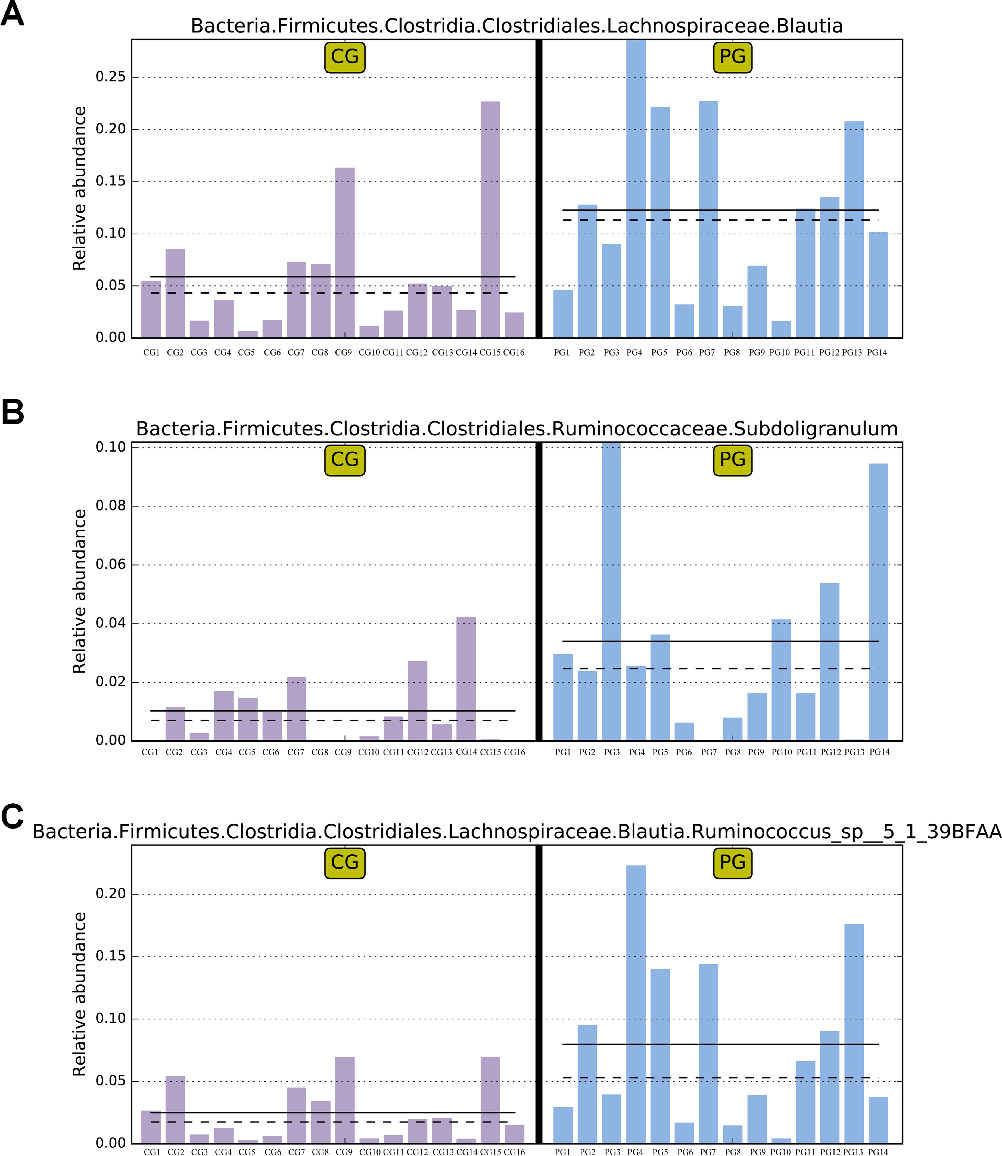
Extended microbiome analysis data from the pregnancy probiotic trial, examining functional diversity shifts in the gut microbiota of mothers and their offspring.
Effect of probiotic administration during pregnancy on the functional diversity of the …
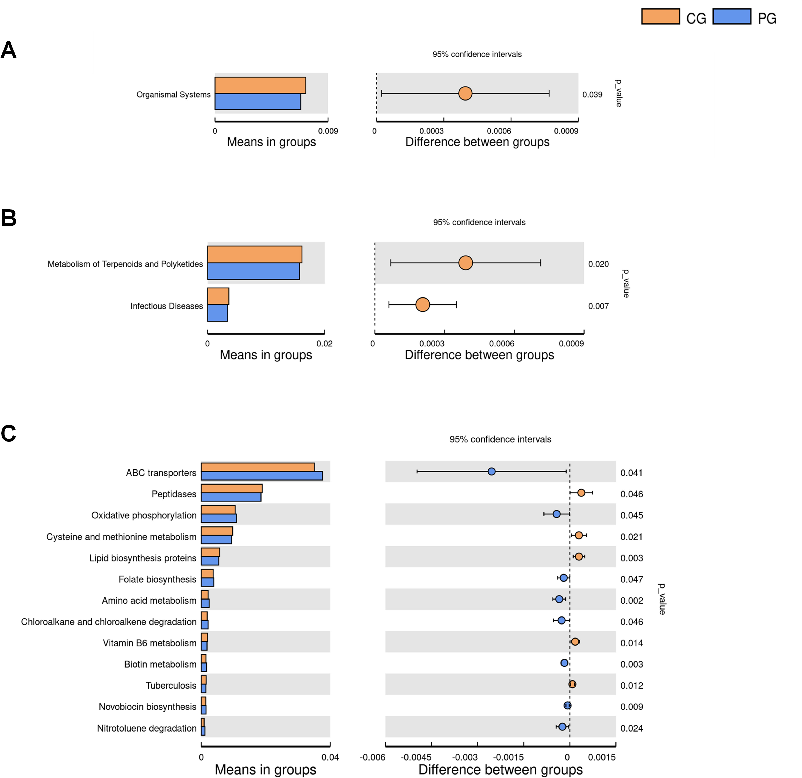
Extended microbiome analysis data from the pregnancy probiotic trial, examining functional diversity shifts in the gut microbiota of mothers and their offspring.
Effect of probiotic administration during pregnancy on the functional diversity of the …
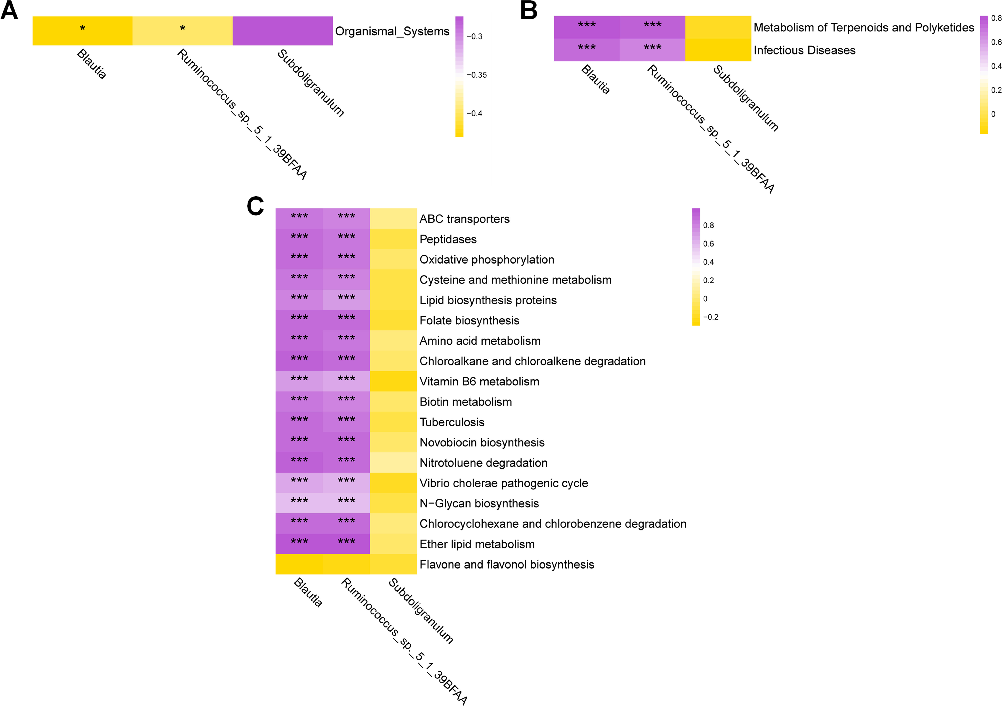
Extended microbiome analysis data from the pregnancy probiotic trial, examining functional diversity shifts in the gut microbiota of mothers and their offspring.
Effect of probiotic administration during pregnancy on the functional diversity of the …
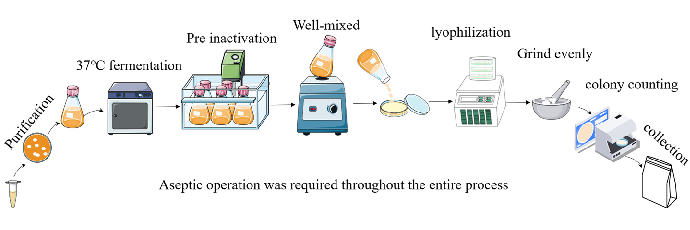
Effects of Lactobacillus paracei JY062 Postbiotic on Intestinal Barrier, Immunity, and Gut …
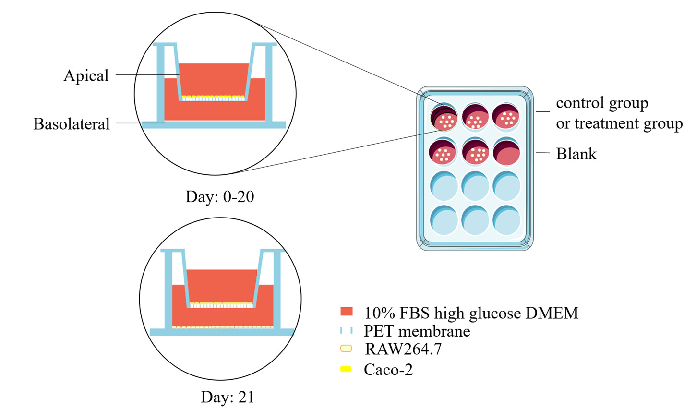
Effects of Lactobacillus paracei JY062 Postbiotic on Intestinal Barrier, Immunity, and Gut …
Effects of Lactobacillus paracei JY062 Postbiotic on Intestinal Barrier, Immunity, and Gut …
Effects of Lactobacillus paracei JY062 Postbiotic on Intestinal Barrier, Immunity, and Gut …
Effects of Lactobacillus paracei JY062 Postbiotic on Intestinal Barrier, Immunity, and Gut …

Effects of Lactobacillus paracei JY062 Postbiotic on Intestinal Barrier, Immunity, and Gut …
Effects of Lactobacillus paracei JY062 Postbiotic on Intestinal Barrier, Immunity, and Gut …
2페이지 중 1페이지