Lavender चित्र
4 सहकर्मी-समीक्षित शोध से आंकड़े
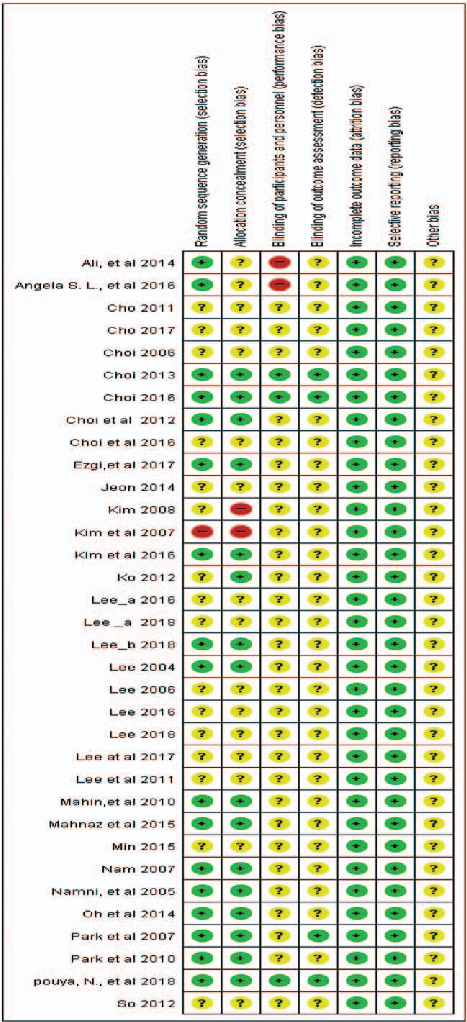
Risk of bias assessment across included studies evaluates methodological quality domains such as randomization, blinding, and outcome reporting in aroma therapy trials.
A systematic literature review and meta-analysis of the clinical effects of aroma …
Traffic-light visualization of risk of bias for individual studies included in the aroma inhalation therapy meta-analysis, generated using RevMan software, reveals varying methodological quality.
A systematic literature review and meta-analysis of the clinical effects of aroma …
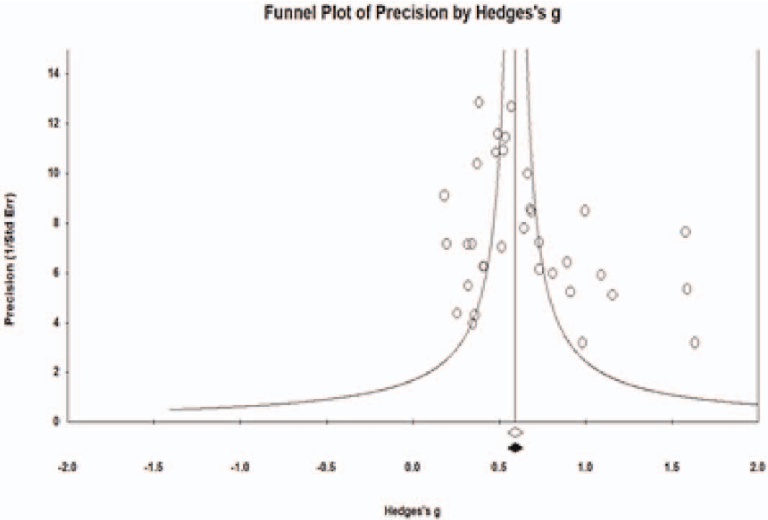
Funnel plot analysis assesses potential publication bias among studies included in the meta-analysis of aroma inhalation therapy for sleep problems, with symmetry indicating low risk.
A systematic literature review and meta-analysis of the clinical effects of aroma …
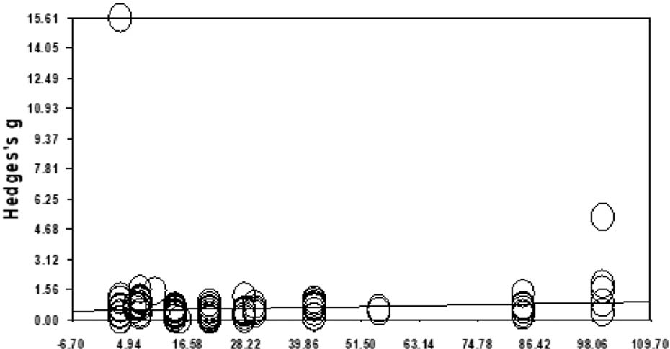
Meta-regression analysis examines whether the effectiveness of aroma inhalation therapy for sleep problems varies by program duration or publication year, revealing trends in the slope of the primary outcome.
A systematic literature review and meta-analysis of the clinical effects of aroma …