Figure 10
680 × 682px
· 138.2 KB
Source Paper
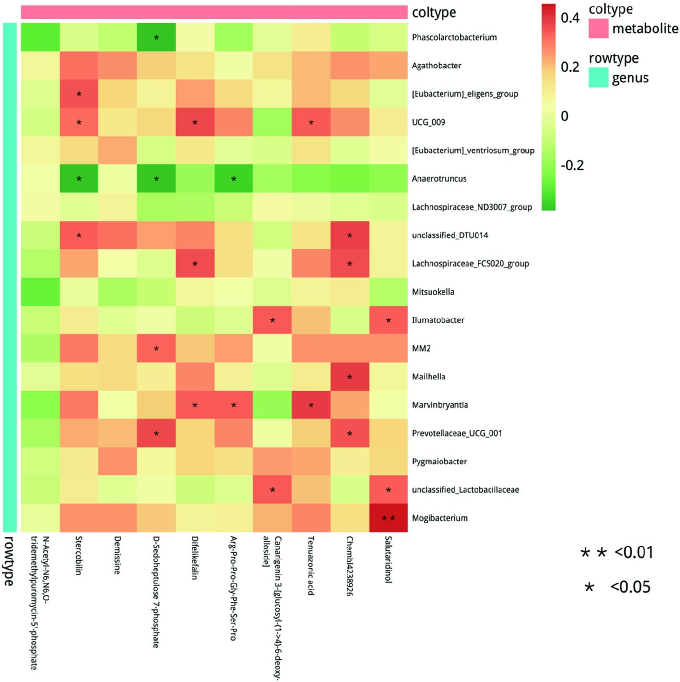
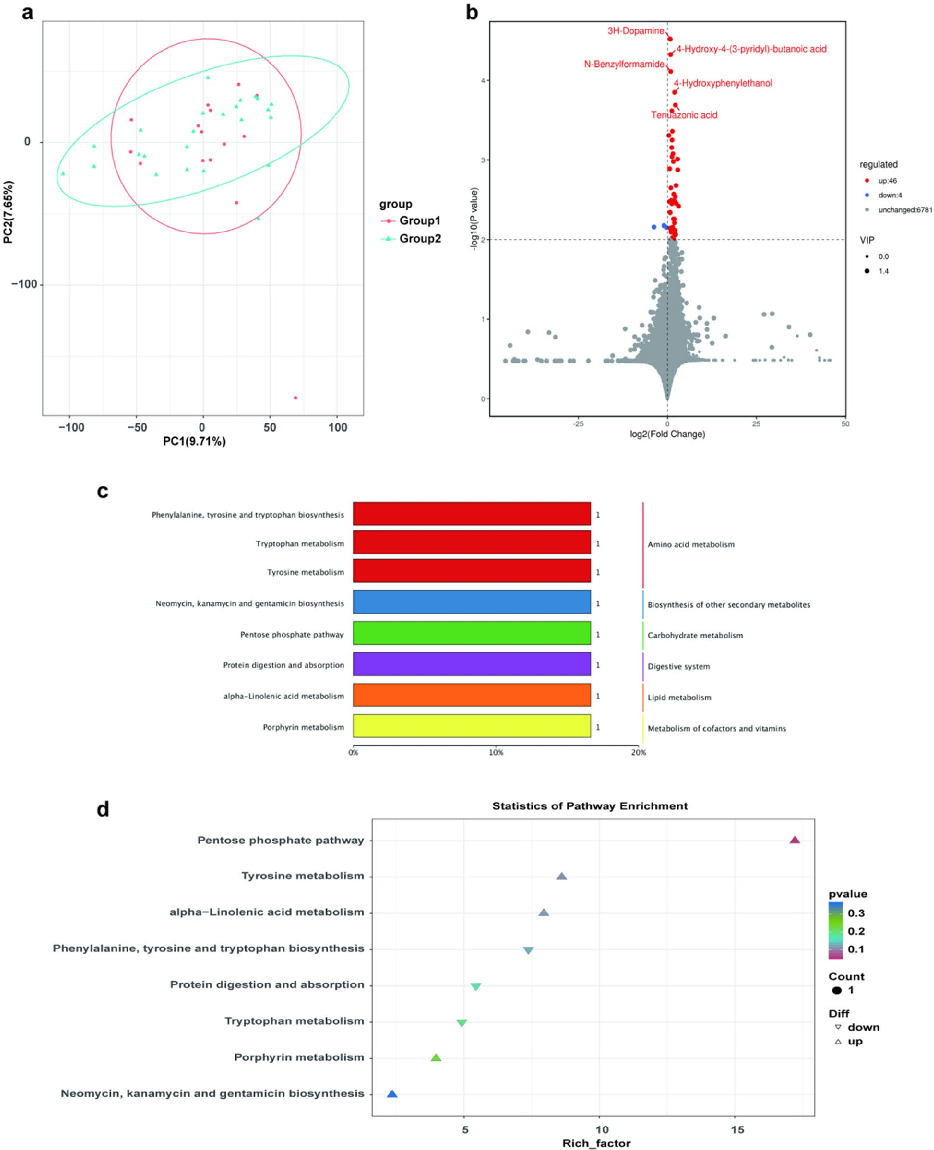
Study on gut microbiota and metabolomics in postmenopausal women.Cite This Figure
 > Source: Xinyuan Xie et al. "Study on gut microbiota and metabolomics in postmenopausal women.." *BMC women's health*, 2024. PMID: [39548431](https://pubmed.ncbi.nlm.nih.gov/39548431/)
<figure> <img src="https://pdfs.citedhealth.com/figures/39548431/112.png" alt="Fig. 5 The relationship between gut microbiota and gut metabolism, with red and yellow indicating positive correlation and green indicating negative correlation. The significance of the chart is represented as follows: P < 0.01 * *, P < 0.5*" /> <figcaption>Figure 10. Fig. 5 The relationship between gut microbiota and gut metabolism, with red and yellow indicating positive correlation and green indicating negative correlation. The significance of the chart is represented as follows: P < 0.01 * *, P < 0.5*<br> Source: Xinyuan Xie et al. "Study on gut microbiota and metabolomics in postmenopausal women.." <em>BMC women's health</em>, 2024. PMID: <a href="https://pubmed.ncbi.nlm.nih.gov/39548431/">39548431</a></figcaption> </figure>