Effects of Lactobacillus paracei JY062 Postbiotic on Intestinal Barrier, Immunity, and Gut Microbiota.
Study Design
- Loại nghiên cứu
- In Vitro
- Đối tượng nghiên cứu
- Caco-2 cells, RAW264.7 macrophages, fecal fermentation
- Can thiệp
- Effects of Lactobacillus paracei JY062 Postbiotic on Intestinal Barrier, Immunity, and Gut Microbiota. 5 mg/mL
- Đối chứng
- LPS-treated cell models
- Kết quả chính
- Intestinal barrier function and gut microbiota
- Xu hướng hiệu quả
- Positive
- Nguy cơ sai lệch
- Unclear
Abstract
Research on postbiotics derived from probiotic fermented milk bases require further expansion, and the mechanisms through which they exert their effects have yet to be fully elucidated. This study utilized in vitro cell co-culture, digestion, and fermentation experiments, combined with targeted T500 technology, to elucidate the mechanism by which postbiotic Pa JY062 safeguards intestinal health. Compared to the LPS group, Pa JY062 boosted phagocytic ability in RAW264.7 macrophages, decreased NO levels, and alleviated LPS-induced excessive inflammation. Pa JY062 suppressed pro-inflammatory cytokines (IL-6, IL-17α, and TNF-α) while elevating anti-inflammatory IL-10. It prevented LPS-induced TEER reduction in Caco-2 monolayers, decreased FITC-dextran permeability, restored intestinal microvilli integrity, and upregulated tight junction genes (ZO-1, occludin, claudin-1, and E-cadherin). The hydrolysis rate of Pa JY062 progressively rose in gastrointestinal fluids in 0-120 min. At 5 mg/mL, it enriched gut microbiota diversity and elevated proportions of Limosilactobacillus, Lactobacillus, Pediococcus, and Lacticaseibacillus while augmenting the microbial production of acetic acid (120.2 ± 8.08 μg/mL), propionic acid (9.9 ± 0.35 μg/mL), and butyric acid (10.55 ± 0.13 μg/mL). Pa JY062 incorporated αs-casein/β-lactoglobulin hydrolysate (L-glutamic acid, alanine, lysine, tyrosine, phenylalanine, histidine, and arginine) to mitigate protein allergenic potential while harboring bioactive components, including tryptophan metabolites, vitamin B6 (VB6), and γ-aminobutyric acid (GABA). Pa JY062 represented a novel postbiotic with demonstrated intestinal health-promoting properties. These findings advance the current knowledge on postbiotic-mediated gut homeostasis regulation and expedite the translational development of dairy-derived postbiotic formulations.
Tóm lược
Pa JY062 represented a novel postbiotic with demonstrated intestinal health-promoting properties that prevented LPS-induced TEER reduction in Caco-2 monolayers, decreased FITC-dextran permeability, restored intestinal microvilli integrity, and upregulated tight junction genes.
Full Text
Effects of Lactobacillus paracei JY062 Postbiotic on Intestinal Barrier, Immunity, and Gut Microbiota
Jinfeng Guo 1,† , Ying Zhao 1,†, Wenqian Guo 1, Yilin Sun 1, Wei Zhang 1, Qianyu Zhao 1, Yu Zhang 1,* and Yujun Jiang 1,2,*
- 1 Key Lab of Dairy Science, Ministry of Education, College of Food Science, Northeast Agricultural University, Harbin 150030, China; [email protected] (J.G.); [email protected] (Y.Z.); [email protected] (W.G.); [email protected] (Y.S.); [email protected] (W.Z.); [email protected] (Q.Z.)
- 2 Food Laboratory of Zhongyuan, Luohe 462300, China
* Correspondence: [email protected] (Y.Z.); [email protected] (Y.J.); Tel.: +86-188-0046-7229 (Y.Z.);
+86-139-3666-0851(Y.J.) † These authors contributed equally to this work.
Academic Editor: Miguel Romero-Pérez
Received: 18 February 2025 Revised: 21 March 2025 Accepted: 3 April 2025 Published: 5 April 2025
Citation: Guo, J.; Zhao, Y.; Guo, W.; Sun, Y.; Zhang, W.; Zhao, Q.; Zhang, Y.; Jiang, Y. Effects of Lactobacillus paracei JY062 Postbiotic on Intestinal Barrier, Immunity, and Gut Microbiota. Nutrients 2025, 17, 1272. https:// doi.org/10.3390/nu17071272
Copyright: © 2025 by the authors. Licensee MDPI, Basel, Switzerland. This article is an open access article distributed under the terms and conditions of the Creative Commons Attribution (CC BY) license (https://creativecommons.org/ licenses/by/4.0/).
Abstract: Background/Objectives: Research on postbiotics derived from probiotic fermented milk bases require further expansion, and the mechanisms through which they exert their effects have yet to be fully elucidated. This study utilized in vitro cell co-culture, digestion, and fermentation experiments, combined with targeted T500 technology, to elucidate the mechanism by which postbiotic Pa JY062 safeguards intestinal health. Compared to the LPS group, Pa JY062 boosted phagocytic ability in RAW264.7 macrophages, decreased NO levels, and alleviated LPS-induced excessive inflammation. Pa JY062 suppressed proinflammatory cytokines (IL-6, IL-17α, and TNF-α) while elevating anti-inflammatory IL-10. It prevented LPS-induced TEER reduction in Caco-2 monolayers, decreased FITC-dextran permeability, restored intestinal microvilli integrity, and upregulated tight junction genes (ZO-1, occludin, claudin-1, and E-cadherin). The hydrolysis rate of Pa JY062 progressively rose in gastrointestinal fluids in 0–120 min. At 5 mg/mL, it enriched gut microbiota diversity and elevated proportions of Limosilactobacillus, Lactobacillus, Pediococcus, and Lacticaseibacillus while augmenting the microbial production of acetic acid (120.2 ± 8.08 µg/mL), propionic acid (9.9 ± 0.35 µg/mL), and butyric acid (10.55 ± 0.13 µg/mL). Pa JY062 incorporated αs-casein/β-lactoglobulin hydrolysate (L-glutamic acid, alanine, lysine, tyrosine, phenylalanine, histidine, and arginine) to mitigate protein allergenic potential while harboring bioactive components, including tryptophan metabolites, vitamin B6 (VB6), and γ-aminobutyric acid (GABA). Pa JY062 represented a novel postbiotic with demonstrated intestinal health-promoting properties. These findings advance the current knowledge on postbiotic-mediated gut homeostasis regulation and expedite the translational development of dairy-derived postbiotic formulations.
Keywords: postbiotics; intestinal barrier; intestinal inflammation; co-culture; gut microbiota
1. Introduction
The intestine played a vital role in nutrient absorption and safeguarding systemic health. Maintaining intestinal barrier integrity is crucial for intestinal homeostasis, which comprises mechanical, chemical, microbial, and immune barriers [1]. Compromise of the mechanical barrier permitted pathogenic bacteria and their endotoxins to infiltrate the lamina propria via intestinal epithelial breaches. In severe cases, these substances
Nutrients 2025, 17, 1272 https://doi.org/10.3390/nu17071272
entered systemic circulation, which triggered systemic inflammatory responses [2]. Functioning as the primary defense component of the intestinal barrier, the mechanical barrier comprised mucosal epithelial cells, intercellular tight junctions, adherent junctions, and desmosomes [3]. Intestinal epithelial cells modulated gut microbiota through antibacterial factor secretion and by mediating bacteria–immune cell interactions. Intestinal homeostasis relied on a balanced interplay among the microbiota, intestinal barrier, and immune system. Notably, gut immune imbalance directly contributed to the pathogenesis of inflammatory bowel diseases (Crohn’s disease and ulcerative colitis). Emerging evidence supported the therapeutic potential of microecological modulators such as probiotics [4], prebiotics [5,6], and postbiotics [7]. These interventions preserved intestinal barrier integrity and reduced inflammatory responses. Notably, microecological modulators demonstrated a favorable safety profile and efficacy without severe adverse effects.
The International Scientific Association of Probiotics and Prebiotics in 2021 defined postbiotics as the “preparation of inanimate microorganisms and/or their components that confer a health benefit on the host” [8]. Postbiotics demonstrated biological efficacy in regulating the homeostasis of the intestinal microbial ecosystem. The preservation of intestinal microbial ecosystem homeostasis relied on the collaborative actions of intestinal microorganisms, epithelial cells, stromal cells, and immune cells. Accumulating evidence has established the efficacy of postbiotics in ameliorating intestinal inflammation and preserving intestinal barrier integrity. Lactobacillus rhamnosus GG postbiotic HM0539 enhanced mucin 2 (MUC2) and zonula occludens-1 (ZO-1) expression and prevented dextran sodium sulfate (DSS)-induced colitis [9]. Bifidobacterium adolescentis B8598 postbiotics ameliorated colitis through decreased histology scores induced by DSS [10]. Batista et al. reported that heat-killed Lactobacillus delbrueckii CIDCA 133 and their cell-free supernatant effectively decreased the infiltration of neutrophils into the small intestine mucosa and enhanced the damaged epithelial structure caused by 5-FU in mice [11].
Our research team discovered three strains of lactic acid bacteria in previous studies demonstrating anti-inflammatory and intestinal barrier-protective effects [12–14]. Milk-based postbiotics were developed through process optimization combining lowtemperature pasteurization with lyophilization, maximizing the retention of bioactive constituents while maintaining functional integrity. The intestinal health-promoting efficacy of postbiotics was systematically evaluated using a Caco-2/RAW264.7 co-culture model, while their digestibility, gut microbiota modulation, and short-chain fatty acid (SCFA) profiles were concurrently assessed through an integrated in vitro digestive–fermentative system. Meanwhile, the composition of postbiotics was analyzed using T500 technology, which helped to accurately understand its ingredient composition, provided strong support for product optimization and mechanism of action research, and laid the groundwork for further elucidating the mechanism through which postbiotics regulate intestinal inflammation. Furthermore, the findings offer accelerated translational opportunities across functional food development, nutraceutical production, pharmaceutical formulations, and livestock management practices.
2. Materials and Methods
- 2.1. Reagents and Materials
LPS and FITC-dextran (4 kDa) were obtained from Sigma-Aldrich (St. Louis, MO, USA). CCK-8 Cell Counting Kit, phosphate-buffered saline (PBS, pH 7.2), penicillin (100 U/mL), and streptomycin (100 µg/mL) were obtained from Biosharp® Life Science (Hefei, China). Dulbecco’s modified Eagle medium (DMEM), high glucose, and fetal bovine serum (FBS) were acquired from Gibco (Grand Island, NY, USA). RNAiso Plus (9108), PrimeScript™ RT reagent Kit with gDNA Eraser (Perfect Real Time) (RR047A), and TB Green®
Premix Ex Taq™ II (Tli RNaseH Plus) (RR820A) were obtained from Takara Biomedical Technology Co., Ltd. (Beijing, China). Mouse Interleukin-6 (IL-6) ELISA Kit, Mouse Interleukin-10 (IL-10) ELISA Kit, Mouse Interleukin-17a (IL-17a) ELISA Kit, and Mouse Tumor Necrosis Factor-α (TNF-α) ELISA Kit were purchased from Xinle Biotechnology (Shanghai, China). NO kit was acquired from Beyotime (Shanghai, China). HPLC-grade acetonitrile (ACN) and methanol (MeOH) were purchased from Merck (Darmstadt, Germany). MilliQ water (Millipore, Bradford, MA, USA) was used in all experiments. All T500 standards were purchased from Sigma-Aldrich (St. Louis, MO, USA) and Shanghai Zhenzhun Biotechnology Co., Ltd (Shanghai, China). Formic acid was bought from Sigma-Aldrich (St. Louis, MO, USA). The remaining products were of analytical grade.
- 2.2. Bacterial Strains and Production of Postbiotic Powder
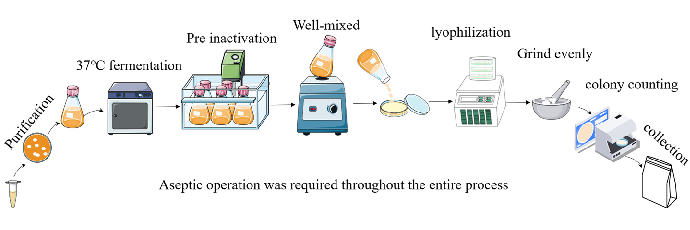
Lactobacillus rhamnosus JL-1, Lactobacillus reuteri J1, and Lactobacillus paracasei JY062 were derived from traditional fermented dairy products in Tibet, China. All strains were passed twice in de Man, Rogosa, and Sharpe (MRS) broth, centrifuged (10,000× g, 5 min, 4 ◦C), washed twice with sterile PBS (pH 7.2), and then reconstituted in skimmed milk containing 2% glucose. A bacterial suspension at 5% inoculum was cultured in skimmed milk containing 2% glucose medium, which was incubated at 37 ◦C with 150 rpm for 16 h. Fermentation broth with skimmed milk was heat inactivated at different temperatures and times (Table 1) and poured into a sterile glass plate, which was sealed with sterile plastic wrap and frozen at −80 ◦C for 24 h. Holes were pierced above each sealed plate with a toothpick, followed by lyophilization for 36 h. The lyophilized product was ground into a sterile powder, and aseptic bags were utilized and kept at 4 ◦C; the postbiotic suspensions were subjected to plate colony counting assay on an MRS agar plate incubated at 37 ◦C for 48 h. Counting results indicated that the survival rate of probiotic-derived postbiotic is 0 (Table 1). The preparation process can be seen in Figure 1A. Postbiotic preparations were designated as follows: Lactobacillus rhamnosus JL-1 (Re JL-1); Lactobacillus reuteri J1 (Rh J1); and Lactobacillus paracasei JY062 (Pa JY062).
Table 1. The conditions for the postbiotics.
Lactobacillus reuteri J1 (CFU/mL)
Lactobacillus rhamnosus JL-1 (CFU/mL)
Lactobacillus paracasei JY062 (CFU/mL)
65 ◦C 30 min before 1.36 × 10¹² 1.32 × 10¹³ 2.42 × 10¹²
65 ◦C 30 min after 100 3400 35,000
70 ◦C 15 min before 1.32 × 10¹² 1.35 × 10¹³ 2.45 × 10¹²
70 ◦C 15 min after 60 350 1500
70 ◦C 30 min before 1.31 × 10¹² 1.36 × 10¹³ 2.61 × 10¹²
70 ◦C 30 min after 0 120 320
75 ◦C 15 min before 1.39 × 10¹² 1.44 × 10¹³ 2.51 × 10¹²
75 ◦C 15 min after 0 40 50
75 ◦C 30 min before - 1.35 × 10¹³ 2.51 × 10¹²
75 ◦C 30 min after - 0 0
lyophilization before 1.36 × 10¹² 1.32 × 10¹³ 2.42 × 10¹²
lyophilization after 500 3800 1500
70 ◦C 15 min and lyophilization before
1.31 × 10¹² 1.36 × 10¹³ 2.61 × 10¹² 70 ◦C 15 min and lyophilization after
0 20 86 70 ◦C 30 min and lyophilization before
- - 1.33 × 10¹³ 2.52 × 10¹² 70 ◦C 30 min and lyophilization after
- - 0 0
Note: - indicates that this step was not implemented.
tion after
Nutrients 2025, 17, 1272 4 of 25
Note: - indicates that this step was not implemented.
- (A)
- (B)
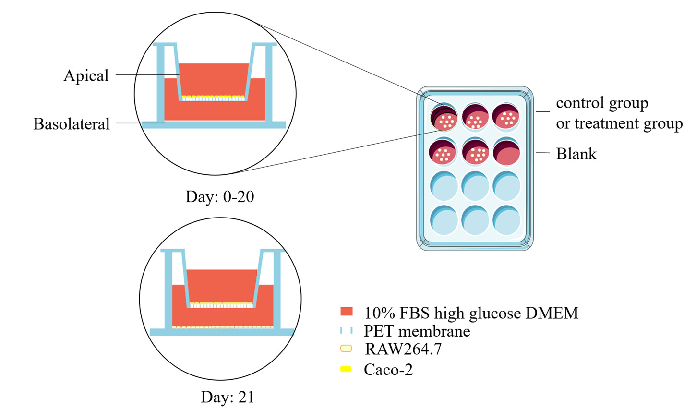
Figure 1. Preparation of postbiotics and cell co-culture model diagram. (A) Diagram illustrating preparation of postbiotics; (B) establishment of Caco-2/RAW264.7 co-culture system.
Figure 1. Preparation of postbiotics and cell co-culture model diagram. (A) Diagram illustrating preparation of postbiotics; (B) establishment of Caco-2/RAW264.7 co-culture system.
- 2.3. Cell Culture and Cell Viability Assay
- 2.4. Co-Culture System of Caco-2/RAW264.7 Cell
2.3. Cell Culture and Cell Viability Assay
RAW264.7 and Caco-2 cells were derived from the Key Laboratory of Dairy Science, Ministry of Education, at the Northeast Agricultural University in China. Caco-2 cells from passages 2 to 10 were utilized, while RAW264.7 cells from passages 1 to 5 were employed due to their favorable differentiation characteristics. Caco-2 and RAW264.7 were maintained in complete cell culture medium, which contained DMEM with high glucose, 10% FBS, 1% penicillin and streptomycin, and they were incubated at 37 °C in a humidified atmosphere containing 5% CO . An amount of 2 × 10⁴ cells per well were inoculated into 96-well plates for 24 h. Following this, postbiotics at varying concentrations of 50, 100, 150, 200, 250, 300, 350, 400, 450, and 500 µg/mL were introduced and cultured for an additional 24 h.
Cell Counting Kit-8 (CCK-8) was used to measure cell viability. First, the cell culture medium with postbiotics was removed and washed three times with PBS. An amount of 100 µL of fresh complete cell culture medium containing 10% CCK-8 premixed in advance was added to each well, and a well without cells was selected as a blank control. The cells were cultured for another 2 h, and the OD450 nm was measured. The cell viability was calculated using the following formula:
Caco-2 cells were seeded in Transwell® 12-well plates (pore size 0.4 µm, Corning, NY, USA) at a density of 2 × 10⁴ cells per well and maintained in culture for a duration of 21
days to obtain a cell monolayer. Cell morphology was recorded using EVOS FL inverted fluorescence microscope at days 0, 7, 14, and 21. The sealing performance of the Caco-2 monolayer was assessed through transepidermal electrical resistance (TEER). TEER was determined as follows: the pre-alcohol-sterilized Millicell ERS volt-ohmmeter and rod probe (Bedford, MA, USA) were washed twice with PBS in a sterile cell clean bench and then carefully placed in the co-culture system. The short electrode was placed in the AP, the long electrode was placed in the BA, and the value read by the Millicell ERS volt-ohmmeter was recorded. TEER was calculated using the following formula:
TEER = (sample resistance blank resistance) × 1.12 cm2
On experimental day 20, RAW264.7 macrophages were seeded in 12-well plates (1 × 10⁵ cells/well) and cultured for 24 h to establish monolayers. Subsequently, Caco-2 Transwell inserts were introduced into the RAW264.7-populated wells to establish a coculture system [15]. Caco-2 cells cultured in Transwell® inserts (12-well) were designated as the apical compartment (AP), while RAW264.7 macrophages in the basolateral chamber (BA) formed the co-culture system. The experimental setup is schematically illustrated in Figure 1B.
- 2.5. In Vitro Paracellular Permeability Assay
- 2.6. Determining the Ultrastructure of the Intestinal Barrier Using Transmission Electron Microscopy
- 2.7. Neutral Red Phagocytosis and NO Assay
RAW 264.7 macrophages were incubated in 96-well plates for 24 h. After replacing the medium with fresh complete medium containing LPS (10 µg/mL), cells were cultured for an additional 12 h. Postbiotics Pa JY062 (300 µg/mL), Re JL-1 (250 µg/mL), and Rh J1 (300 µg/mL) were then added to the medium, and cells were incubated for 24 h. One subset of cells was used for the neutral red phagocytosis assay, and another subset was used for NO detection. For phagocytosis analysis, 100 µL of 0.1% neutral red solution was added to each well, and the mixtures were incubated for 3 h. After removing the supernatant and washing with PBS, 150 µL of cell lysis buffer was added to each well. The plate was gently agitated for 15 min, and absorbance was measured at 540 nm [18].
NO assay was carried out according to the instructions provided in the NO kit.
1 − (sampleA − blankA) modelA − blankA) × 100%
Inhibition rate % =
- 2.8. Cellular Inflammatory Factor Assay
- 2.9. RNA Extraction and Real-Time Quantitative Polymerase Chain Reaction Total RNA was isolated from LPS/postbiotic-treated Caco-2 monolayers and RAW264.7
macrophages using RNAiso Plus. RNA purity (1.8 ≤ A260/A280 ≤ 2.1) [19] and concentration were quantified with a NanoDrop™ ND-2000 spectrophotometer (Thermo Fisher Scientific, Waltham, MA, USA), shown in Table S1. The RNA was synthesized into cDNA using PrimeScript™ RT reagent Kit with gDNA Eraser, and the detailed process is shown in Tables S2 and S3. Real-time quantitative polymerase chain reaction (RT-qPCR) was carried out according to TB Green® Premix Ex Taq™ II, and the detailed process is shown in Tables S4 and S5. RT-qPCR was used to determine relative expression levels of mRNA according to 2−△△Ct method. The GAPDH was employed as a housekeeper gene. The primers used in the RT-qPCR analysis are shown in Table 2.
Table 2. Specific primer sequences.
Primer Name Forward Primer (5′-3′) Reverse Primer (5′-3′)
ZO-1 TGAGGCAGCTCACATAATGC GGTCTCTGCTGGCTTGTTTC Occludin AAAGGGCATTGCTCATCCTGA ACAATGGCAATGGCAATTCATC
- Claudin-1 CCAGTCAATGCCAGGTACGAAT GGCCTTGGTGTTGGGTAAGA
- Claudin-2 CCATGGTCAACACAACAGCA GGCATCTAGAAGACCTGAATGG E-cadherin CCCAAACGTAACGAGGGTATC GGCAGCTTGAAGTGGTAGAAGT
ACTGAACCTGACCGTACACC TTCTCCAAGAAATTCTCA
α-catenin CAACCCTTGTAAACACCAAT
β-catenin CGCTTGGCTGAACCATCACA AGCAGCTTTATTAACTACCACCT
IL-1β GGACAGGATATGGAGCAACAAGTGG TCATCTTTCAACACGCAGGACAGG IL-12 p40 AGACCCTGCCCATTGAACTG CAGGAGTCAGGGTACTCCCA IL-23 p19 AGAGCCAGCCAGATYTGAGAAG CTGCTCCRTGGGCAAAGA
TGF-β TACAGCAACAATTCCTGGCGATACC CTCAACCACTGCCGCACAACTC GAPDH F: GAGAAGGCTGGGGCTCATTT TAAGCAGTTGGTGGTGCAGG
- 2.10. Static Simulation of Gastrointestinal Digestive Processes In Vitro
According to the INFOGEST protocol [20], PaJY062 powder was combined with ultrapure water at a 1 g:1 g ratio. A digestive chylous analog was prepared on a sterile plate using a glass rod and simulated gastric fluid (SGF) that included pepsin and gastric lipase (pH 3.0) diluted with chylous analog at a 2:2 ratio (v/v), and it was continuously stirred for 2 h to obtain gastric chyme at 37 ◦C at 80 rpm. Simulated intestinal fluid (SIF) including bile salts and trypsin was used after being diluted with gastric chyme at a ratio of 4:4 (v/v), adjusted to pH 7.0 with 4 M NaOH, and incubated for 2 h under 80 rpm/h for 2 h. In the stomach and intestinal simulations, a 0.5 mg/mL methanol solution of Pepstatin A was added at 0, 1, 2, 5, 10, 30, 60, and 120 min. The enzymatic reaction was halted at the conclusion of gastrointestinal digestion. Digestive juice was frozen and stored at −20 ◦C for subsequent analyses.
- 2.11. Degree of Protein Hydrolysis
- 2.12. Simulated Gut Fermentation In Vitro
- 2.13. Analysis of 16S rRNA in Gut Microbes
Gut microbe samples treated with 1, 2, 3, 4, and 5 mg/mL of PaJY062 were separately placed into centrifuge tubes and then introduced into centrifuge tubes containing the extraction lysate, and DNA was procured using the DNA Kit (D5635-02) (Omega Bio-Tek, Norcross, GA, USA). The V3-V4 segment of the gut microbes 16S rRNA gene was amplified through PCR. PCR products were quantified with the Quant-iT PicoGreen dsDNA Assay Kit and subsequently combined based on the necessary quantity for each sample. Illumina TruSeq Nano DNA LT Library Prep Kit (Personal Biotechnology, Shanghai, China) was employed to obtain library preparation. In the QIIME2 software (2024.10), the number of sequences extracted at each depth and their corresponding ASV numbers were plotted to draw a rarefaction curve, depicting the microbial diversity within the community sample. Beta diversity analysis was conducted utilizing the UniFrac distance metric with R software and QIIME2 software to explore variations in microbial community structure across samples.
- 2.14. Short Chain Fatty Acids in Gut Microbes
- 2.15. The Analysis of Pa JY062 Ingredients
Standard stock solutions (1 mg/mL) were prepared in methanol (MeOH) or appropriate solvents, aliquoted, and cryopreserved at −20 ◦C. Working solutions were generated through serial dilution with MeOH prior to analysis. Thawed Pa JY062 samples underwent brief vortex homogenization (10 sec), followed by centrifugation (12,000× g, 1 min, 4 ◦C) to ensure homogeneity. Samples (50 µL) were mixed with 250 µL of 20% (v/v) acetonitrile/methanol solution, followed by 3 min vortex homogenization and centrifugation (12,000× g, 10 min, 4 ◦C). The resultant supernatant (250 µL) was transferred to fresh tubes, incubated at −20 ◦C for 30 min to precipitate residual proteins, and subjected to secondary centrifugation (12,000× g, 10 min, 4 ◦C). Finally, 180 µL of clarified supernatant was filtered through a protein precipitation plate prior to LC-MS analysis. Sample extracts were analyzed using an LC-ESI-MS/MS system (UPLC, ExionLC AD, https://sciex.com.cn/; MS, QTRAP® 6500+ System, https://sciex.com/). The LC-ESI-MS/MS system was accessed on 22 March 2024. The analytical conditions were as follows.
T3 method: HPLC: column, Waters ACQUITY UPLC HSS T3 C18 (100 mm × 2.1 mm i.d.′1.8 µm); solvent system, water with 0.05% formic acid (A) and acetonitrile with 0.05% formic acid (B). The gradient was started at 5% B (0 min), increased to 95% B (8–9.5 min), and finally ramped back to 5% B (9.6–12 min); flow rate, 0.35 mL/min; temperature, 40◦C; injection volume, 2 µL.
Amide method: HPLC: column, ACQUITY UPLC BEH Amide (i.d. 2.1 × 100 mm,
- 1.7 µm); solvent system, water with 10 mM Ammonium acetate, 0.3% ammonium hydroxide (A), and 90% acetonitrile/water (v/v) (B). The gradient was started at 95% B (0–1.2 min), decreased to 70% B (8 min) and 50% B (9–11 min), and finally ramped back to 95% B (11.1– 15 min); flow rate, 0.4 mL/min; temperature, 40 ◦C; injection volume, 2 µL. SI-MS/MS conditions were as follows: linear ion trap (LIT) and triple quadrupole (QQQ) scans were acquired on a triple quadrupole-linear ion trap mass spectrometer (QTRAP), a QTRAP® 6500+ LC-MS/MS System, equipped with an ESI Turbo Ion-Spray interface, operating
both positive and negative ion modes and controlled using Analyst 1.6.3 software (Sciex).
ture, 550 °C; ion spray voltage (IS), 5500 V (positive) and −4500 V (negative); and curtain gas (CUR), 35 psi. Metabolites were analyzed using scheduled multiple reaction monitoring (MRM). Data acquisitions were performed using Analyst 1.6.3 software (Sciex). Multiquant 3.0.3 software (Sciex) was used to quantify all metabolites. Mass spectrometer parameters, including the declustering potentials (DPs) and collision energies (CEs) for individual MRM transitions, were determined with further DP and CE optimization. A specific set of MRM transitions were monitored for each period according to the metabolites eluted within this period.
in both positive and negative ion modes and controlled using Analyst 1.6.3 software (Sciex). The ESI source operation parameters were as follows: ion source, ESI+/−; source temperature, 550 ◦C; ion spray voltage (IS), 5500 V (positive) and −4500 V (negative); and curtain gas (CUR), 35 psi. Metabolites were analyzed using scheduled multiple reaction monitoring (MRM). Data acquisitions were performed using Analyst 1.6.3 software (Sciex). Multiquant 3.0.3 software (Sciex) was used to quantify all metabolites. Mass spectrometer parameters, including the declustering potentials (DPs) and collision energies (CEs) for individual MRM transitions, were determined with further DP and CE optimization. A specific set of MRM transitions were monitored for each period according to the metabolites eluted within this period.
- 2.16. Statistical Analysis
- 3. Results 3.1. Postbiotics Promoted Cell Viability in a Manner Dependent on Dosage
- 2.16. Statistical Analysis
- 3. Results 3.1. Postbiotics Promoted Cell Viability in a Manner Dependent on Dosage
A cell viability assessment revealed that postbiotics dose-dependently enhanced RAW264.7 cell viability versus the untreated controls (Ctrl), with Pa JY062 (300 µg/mL) exhibiting the most pronounced enhancement (p < 0.001, Figure 2A). Notably, postbiotic treatments maintained Caco-2’s proliferative capacity (Figure 2B), showing maximal viability at 250 µg/mL of Pa JY062. Based on these findings, Pa JY062 and Rh J1 were prioritized for subsequent mechanistic investigations.
A cell viability assessment revealed that postbiotics dose-dependently enhanced RAW264.7 cell viability versus the untreated controls (Ctrl), with Pa JY062 (300 µg/mL) exhibiting the most pronounced enhancement (p < 0.001, Figure 2A). Notably, postbiotic treatments maintained Caco-2’s proliferative capacity (Figure 2B), showing maximal viability at 250 µg/mL of Pa JY062. Based on these findings, Pa JY062 and Rh J1 were prioritized for subsequent mechanistic investigations.
135
130
125
120
115
110
105
100
95
90
85
80
Ctrl
75
*
Rh J1
70
Re JL-1
65
*** Pa JY062
60
55
50
(μg/mL)
0 50 100 150 200 250 300 350 400 450 500 550
120
115
110
105
Cell viability of Caco-2 (%)
100
95
90
85
80
Ctrl
*
Rh J1
75
Re JL-1
70
**
Pa JY062
65
60
55
50
(μg/mL)
0 50 100 150 200 250 300 350 400 450 500 550
(A) (B)
Figure 2. Dose-dependent effects of postbiotics on cellular viability after 24 h treatment. (A) Viability of RAW264.7 macrophages; (B) viability of Caco-2 intestinal epithelial cells. Postbiotics were tested at concentrations of 50–500 µg/mL. Data represent mean ± SD (n = 5 biological replicates). Statistical significance versus untreated controls: * p < 0.05, ** p < 0.01, *** p< 0.001.
3.2. The Effect of Postbiotics on Intestinal Barrier Integrity
Caco-2 monolayers recapitulated morphological and functional hallmarks of intestinal epithelial differentiation [25]. During the 21-day differentiation period (days 0–21), Caco-2 cells progressively transitioned from dispersed single cells to confluent polarized monolayers, ultimately establishing a mature epithelial barrier characterized by tight junction integrity and brush border formation (Figure 3A).
Nutrients 2025, 17, 1272 shown in Figure 3D, both Rh J1 and Pa JY062 significantly attenuated LPS-induced barrier10 of 25
A
B
Day 0 Day 7
Day 14 Day 21
500
450
400
350
300
250
200
150
100
50
0
day
0 5 10 15 20 25
C
2TEER(Ω.cm)
450
400
350
300
250
200
Ctrl LPS Rh J1
##
# #
150
Pa JY062
100
(h)
0 6 12 18 24 30 36 42 48 54 60 66 72 78
D
Figure 3.Figure 3. Protective effects of postbiotics on intestinal barrier integrity. (Protective effects of postbiotics on intestinal barrier integrity. (A) Morphological evolution ofA) Morphological evolution
Caco-2 monolayers during differentiation (20× magnification); (B) trans epithelial electrical resistance (TEER) dynamics during 21-day monolayer maturation (days 0, 7, 14, and 21); (C) TEER modulation by postbiotics in LPS-induced barrier dysfunction; (D) FITC-dextran paracellular flux quantification in LPS-challenged monolayers. Data are presented as mean ± SD (n = 5); # p < 0.05, ## p<0.01, ### p < 0.001 vs. LPS group. Different shapes in the figure represent different samples, and the same shape represents a repetition of the sample.
TEER, quantified by ionic flux through the paracellular pathway, served as a quantitative biomarker of monolayer integrity and tight junction maturation [26]. The attainment of TEER ≥ 400 Ω·cm2 (day 15: 400.0 ± 9.6 Ω·cm2) confirmed the establishment of functional barrier competence [27], with subsequent stabilization (days 18–21) demonstrating robust intestinal barrier maturation through Caco-2 differentiation (Figure 3B).
D
To assess the barrier protective efficacy of postbiotics against LPS-induced intestinal barrier dysfunction, TEER of Caco-2 monolayers was monitored at 0, 12, 24, 48, and 72 h post-treatment. LPS challenge caused severe barrier disruption, reducing TEER by 238.2 ± 0.35 Ω·cm2 over 72 h (p < 0.001; Figure 3C). Notably, Pa JY062 exhibited the most pronounced barrier protective efficacy, limiting TEER reduction to 107.93 ± 3.64 Ω·cm2 (p < 0.001 vs. LPS group), indicative of preserved paracellular permeability and tight junction integrity.
Figure 3. Protective effects of postbiotics on intestinal barrier integrity. (A) Morphological evolution of Caco-2 monolayers during differentiation (20× magnification); (B) trans epithelial electrical resistance (TEER) dynamics during 21-day monolayer maturation (days 0, 7, 14, and 21); ( modulation by postbiotics in LPS-induced barrier dysfunction; (D) FITC-dextran paracellular flux quantification in LPS-challenged monolayers. Data are presented as mean ± SD (n = 5); # p < 0.05, ##p<0.01,### p < 0.001 vs. LPS group. Different shapes in the figure represent different samples, and the same shape represents a repetition of the sample.
To further analyze the effects of postbiotics on intestinal barrier integrity, paracellular permeability was assessed by measuring FITC-dextran across Caco-2 monolayers. As shown in Figure 3D, both Rh J1 and Pa JY062 significantly attenuated LPS-induced barrier disruption, with Pa JY062 demonstrating the most potent protective efficacy (p < 0.01).
3.3. The Effect of Postbiotics on the Intestinal Barrier Microstructure
3.3. The Effect of Postbiotics on the Intestinal Barrier Microstructure
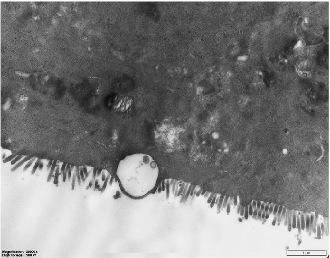
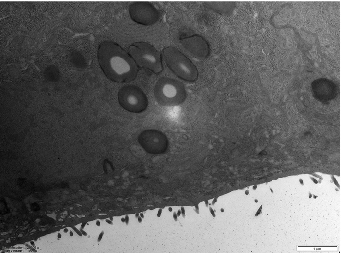
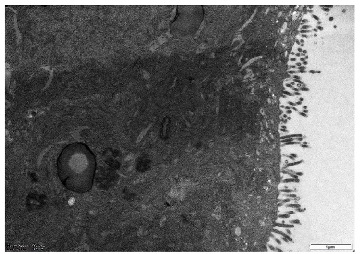
Microvilli are critical ultrastructural components of the intestinal epithelium; they can maintain epithelial barrier integrity and regulate paracellular permeability [28]. Transmission electron microscopy revealed distinct morphological differences: the control (Ctrl) monolayers exhibited densely packed microvilli with organized brush borders, whereas treated LPS displayed severe loss of microvilli and widened intercellular spaces accompanied with a disordered manner (Figure 4). Postbiotic intervention restored the density and structural organization of microvilli across all groups, with Pa JY062 demonstrating the most significant microvillus morphology.
Microvilli are critical ultrastructural components of the intestinal epithelium; they can maintain epithelial barrier integrity and regulate paracellular permeability [28]. Transmission electron microscopy revealed distinct morphological differences: the control (Ctrl) monolayers exhibited densely packed microvilli with organized brush borders, whereas treated LPS displayed severe loss of microvilli and widened intercellular spaces accompanied with a disordered manner (Figure 4). Postbiotic intervention restored the density and structural organization of microvilli across all groups, with Pa JY062 demonstrating the most significant microvillus morphology.
, x FOR PEER REVIEW
Ctrl LPS
Rh J1 Pa JY062
- Figure 4. The effect of postbiotics on the ultrastructure in LPS-induced intestinal epithelial barrier dysfunction (magnification: ×20,000; n = 3).
Figure 4. The effect of postbiotics on the ultrastructure in LPS-induced intestinal epithelial barrier dysfunction (magnification: ×20,000; n = 3).
3.4. The Influence of Postbiotics on the mRNA Expression of Intestinal Barrier Protein
3.4. The Influence of Postbiotics on the mRNA Expression of Intestinal Barrier Protein
To comprehensively analyze the impact of postbiotic intestinal barrier injury, we conducted the mRNA expression of tight junction proteins (ZO-1, occludin, claudin-1, and claudin-2) and adhesive junction proteins (E-cadherin, α-catenin, and β-catenin). Postbiotics significantly increased the mRNA expression of ZO-1, occludin, and claudin-1 (Figure 5A C)
To comprehensively analyze the impact of postbiotic intestinal barrier injury, we conducted the mRNA expression of tight junction proteins (ZO-1, occludin, claudin-1, and claudin-2) and adhesive junction proteins (E-cadherin, α-catenin, and β-catenin). Postbiotics significantly increased the mRNA expression of ZO-1, occludin, and claudin-1 (Figure 5A−C)
compared to the LPS group; the mRNA expression of claudin-2 (Figure 5D) was significantly decreased; and the Pa JY062 group showed the most significant regulation effect (p < 0.001). Meanwhile, postbiotics successfully reversed the decrease in E-cadherin (Figure 5E) mRNA expression caused by LPS, with Pa JY062 showing the best effect compared to the LPS group. Postbiotic intervention showed a trend toward upregulating the mRNA expression of α-catenin (Figure 5F) and β-catenin (Figure 5G) compared to the LPS group, though these alterations remained statistically non-significant (p > 0.05).
A B
C D
E F
G
Figure 5. The effect of postbiotics on the relative mRNA expression of tight junctions (ZO-1, occludin, claudin-1, and claudin-2) and adhesive junctions (E-cadherin, α-catenin, and β-catenin) in LPS-induced intestinal epithelial barrier dysfunction. (A) ZO-1; (B) occludin; (C) claudin-1; (D) claudin-2; (E) Ecadherin; (F) α-catenin; and (G) β-catenin. The values are expressed as the mean ± SD (n = 5); # p < 0.05, ## p < 0.01, ### p < 0.001, and #### p < 0.0001 vs. the LPS. Different shapes in the figure represent different samples, and the same shape represents a repetition of the sample.
- Figure 5. The effect of postbiotics on the relative mRNA expression of tight junctions (ZO-1, occludin, claudin-1, and claudin-2) and adhesive junctions (E-cadherin, α-catenin, and β-catenin) in LPSinduced intestinal epithelial barrier dysfunction. (A) ZO-1; (B) occludin; (C) claudin-1; (D) claudin-2;
E) E-cadherin; (F) α-catenin; and (G) β-catenin. The values are expressed as the mean ± SD (n = 5); # p < 0.05, ## p < 0.01, ### p < 0.001, and #### p < 0.0001 vs. the LPS. Different shapes in the figure represent different samples, and the same shape represents a repetition of the sample.
3.5. The Influence of Postbiotics on Intestinal Inflammation
The compromise of the intestinal barrier resulted in immune dysfunction within the gut, consequently exacerbating the onset of intestinal inflammation. To provide a more comprehensive understanding of the influence of postbiotics on intestinal health, we employed a co-culture model of Caco-2 and RAW264.7 cells to investigate the effects of postbiotics on the interplay between intestinal epithelial cells and immune cells. Pa JY062 significantly improved the phagocytic ability (p < 0.001, Figure 6A) and reduced the production of NO (p < 0.01, Figure 6B) in RAW264.7 compared to the LPS group. Pa JY062 reduced the contents of IL-6, IL-17a, and TNF-α and enhanced the content of IL-10 (Figure 6C). Pa JY062 reduced the mRNA expression of IL-1β, IL-12p40, and IL-23p19 while increased the mRNA expression levels of TGF-β (Figure 6D).
, x FOR PEER REVIEW 14 of 28
A B
C
D
Nutrients , x FOR PEER REVIEW
Nutrients 2025, 17, 1272 14 of 25
TGF-β mRNA expression
Figure 6. The influence of postbiotics on intestinal inflammation. (A) The impact of postbiotics on RAW264.7 cells based on the rate of neutral red phagocytosis. (B) The impact on the NO content of postbiotics. (C) The impact of postbiotics on RAW264.7 cells based on the contents of IL-6, IL-10, IL17a, and TNF-α. (D) The impact of postbiotics on the mRNA expression of IL-1β, IL-12p40, IL-23p19, and TGF-β. The values are expressed as the mean ± SD (n = 5); # p < 0.05, ## p < 0.01, ### p < 0.001, and #### p < 0.0001 vs. the LPS. Different shapes in the figure represent different samples, and the same shape represents a repetition of the sample.
Figure 6. The influence of postbiotics on intestinal inflammation. (A) The impact of postbiotics on RAW264.7 cells based on the rate of neutral red phagocytosis. (B) The impact on the NO content of postbiotics. (C) The impact of postbiotics on RAW264.7 cells based on the contents of IL-6, IL-10, IL17a, and TNF-α. (D) The impact of postbiotics on the mRNA expression of IL-1β, IL-12p40, IL-23p19, and TGF-β. The values are expressed as the mean ± SD (n = 5); # p < 0.05, ## p < 0.01, ### p < 0.001, and #### p < 0.0001 vs. the LPS. Different shapes in the figure represent different samples, and the same shape represents a repetition of the sample.
- , x FOR PEER REVIEW 16 of 28
- 3.6. Effects of PaJY062 on Protein Digestion in In Vitro Simulated Digestion Model
- 3.7. Effect of PaJY062 on Gut Microbiota and SCFAs
3.6. Effects of PaJY062 on Protein Digestion in In Vitro Simulated Digestion Model
The degree of hydrolysis of PaJY062 gradually increased in gastric juice over a period of 0 to 120 min (an increase of 9.02%), whereas it rose by 14.94% in intestinal juice, suggesting that PaJY062 can be effectively utilized, particularly in the intestine (Figure 7). Good protein hydrolysis resulted in the production of more easily digestible small peptides and amino acids (see the ingredients of Pa JY062 for details).
Figure 7. Changes in proteolysis rate of postbiotics over 0–120 min of in vitro digestion. Values are expressed as mean ± SD (n = 3).
3.7. Effect of PaJY062 on Gut Microbiota and SCFAs
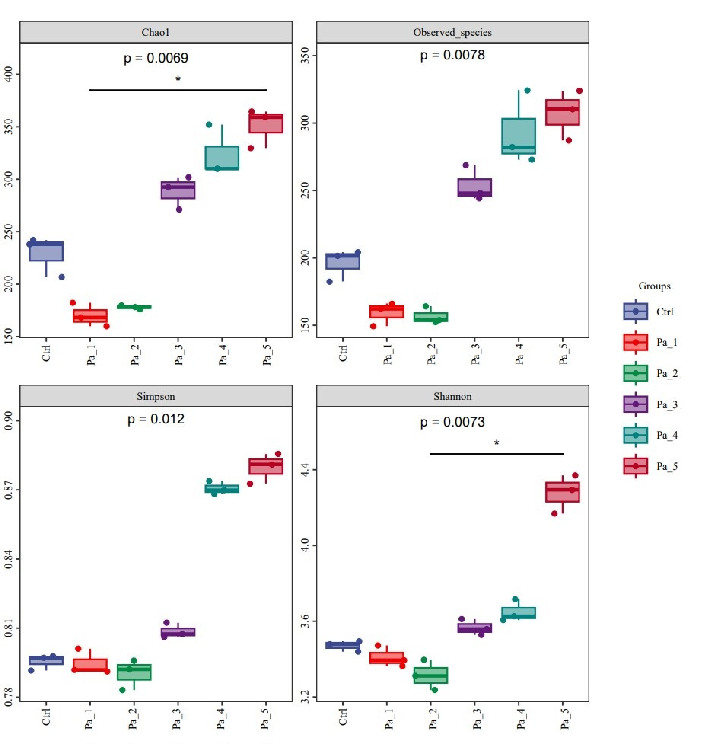
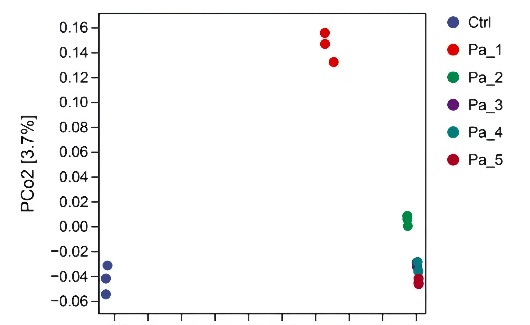
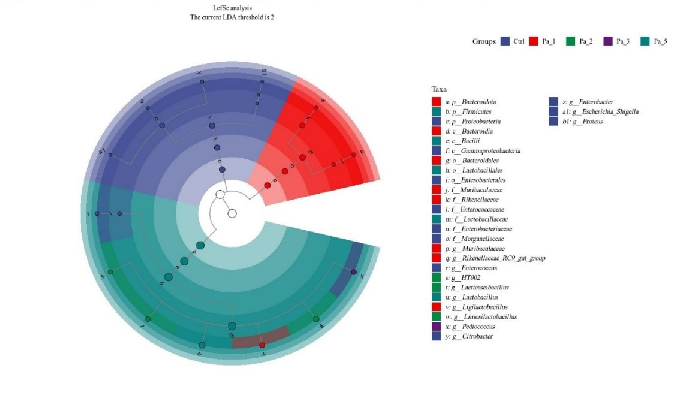
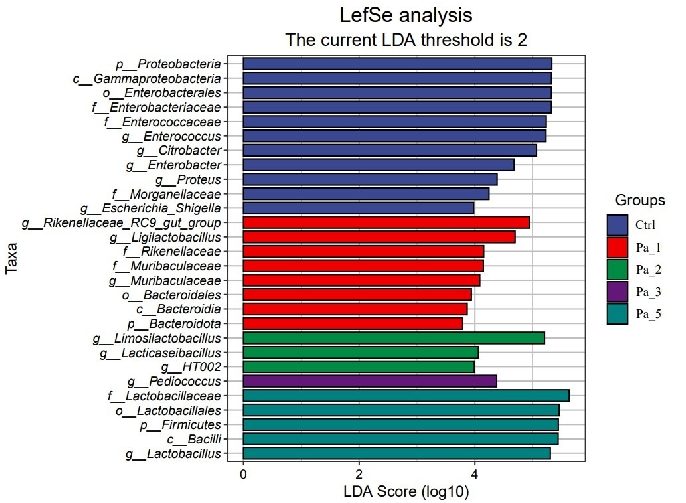
After gastrointestinal digestion, PaJY062 was further fermented in vitro using mice feces to investigate its influences on the intestinal microbiota of colitis mice. Alpha diversity typically encompassed Chao1 and the observed species indices, which delineated richness, along with the Shannon and Simpson indices, which delineated diversity [29]. Chao1 and the observed species indices increased at 5 mg/mL (Pa_5) of PaJY062, suggesting that PaJY062 could improve the species richness of the intestinal microbiota of mice suffering from colitis. For the Shannon and Simpson indices at Pa_5, PaJY062 exerted a more pronounced influence on the α diversity of the gut microbiota in mice afflicted with colitis (Figure 8A). Beta diversity refers to the differences in species composition among various communities across environmental gradients; thus, it is also called between-habitat diversity [29]. The PCoA diagram illustrates that the distances between Ctrl, Pa_1, and Pa_2
After gastrointestinal digestion, PaJY062 was further fermented in vitro using mice feces to investigate its influences on the intestinal microbiota of colitis mice. Alpha diversity typically encompassed Chao1 and the observed species indices, which delineated richness, along with the Shannon and Simpson indices, which delineated diversity [29]. Chao1 and the observed species indices increased at 5 mg/mL (Pa_5) of PaJY062, suggesting that PaJY062 could improve the species richness of the intestinal microbiota of mice suffering from colitis. For the Shannon and Simpson indices at Pa_5, PaJY062 exerted a more pronounced influence on the α diversity of the gut microbiota in mice afflicted with colitis (Figure 8A). Beta diversity refers to the differences in species composition among various communities across environmental gradients; thus, it is also called between-habitat diversity [29]. The PCoA diagram illustrates that the distances between Ctrl, Pa_1, and
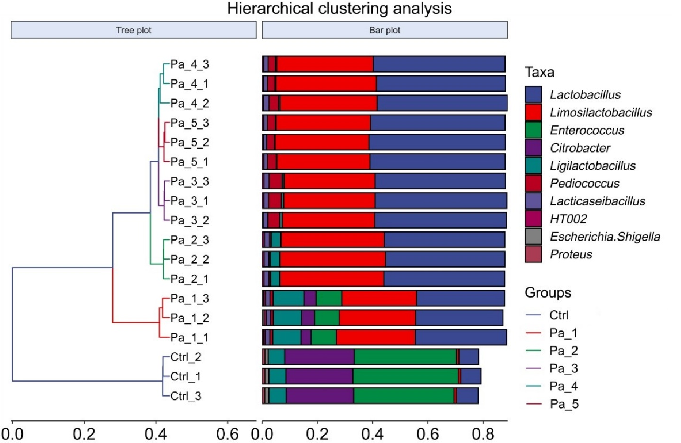
are quite substantial, indicating significant beta diversity among them, while the overlap among Pa_3, Pa_, and Pa_5 indicate that they are similar in beta diversity (Figure 8B). As PaJY062 was introduced, there was a noticeable shift in the composition of intestinal species in colitis mice. It was observed that compared to the Ctrl, the proportion of Limosilactobacillus, Lactobacillus, Pediococcus, and Lacticaseibacillus in the in vitro fermentation of intestinal microbiotas increased progressively with the rising concentration of PaJY062. The proportion of Enterococcus, the opportunistic pathogen Citrobacter, and the harmful bacteria Escherichia shigella decreased (Figure 8C).
- , x FOR PEER REVIEW 17 of 28
had the greatest effect on the acetate concentration, increasing it by 120.19 ± 6.53 µg/mL compared with 857.97 ± 19.67 µg/mL in the control group, which was consistent with the diversity of the intestinal microbiota. Simultaneously, the incorporation of PaJY062 exerted a considerable influence on the propionic acid and butyric acid levels.
- A
- B
NutrientsNutrients20252025, 1717, 1272, x FOR PEER REVIEW 18 of 2816 of 25
- C
- D
- E
Nutrients 17, x FOR PEER REVIEW
Nutrients 2025, 17, 1272 17 of 25
Butyric acidμg/mL
F
Figure 8. Effect of change in different concentrations of PaJY062 on gut microbiota and production of SCFAs. (A) Alpha diversity index; (B) beta diversity; (C) composition species; (D) linear discriminant analysis (LDA); (E) LDA Effect Size (LEfSe) analysis; (F) change in SCFAs. Values are presented as mean ± SD (n = 3). * p < 0.05, *** p < 0.001 and **** p < 0.0001 vs. Ctrl. Different shapes in the figure represent different samples, and the same shape represents a repetition of the sample.
Figure 8. Effect of change in different concentrations of PaJY062 on gut microbiota and production of SCFAs. (A) Alpha diversity index; (B) beta diversity; (C) composition species; (D) linear discriminant analysis (LDA); (E) LDA Effect Size (LEfSe) analysis; (F) change in SCFAs. Values are presented as mean ± SD (n = 3). * p < 0.05, *** p < 0.001 and**** p < 0.0001 vs Ctrl. Different shapes in the
To identify the specific groups that were significantly influenced by PaJY062, linear discriminant analysis (LDA) and LDA Effect Size (LEfSe) analysis were performed, with the results presented in Figure 8D,E. The LDA score bar positively correlates with the relative abundance of discriminative bacterial taxa. It was observed that the abundance of Ligilactobacilus, Limosilactobacillus, Lactobacillaceae, Lactobacillaceae, and Lactobacillus increased with the addition of PaJY062.
3.8. PaJY062 Contained a Variety of Beneficial Ingredients
The components of Pa JY062 are elaborated on in Table 3, wherein 14 substances exhibited a concentration exceeding 100,000 ng/mL in addition to the metabolites of tryptophan (specifically, 3-indolactic acid, indole-3-carboxaldehyde, tryptophol, pyridoxal hydrochloride, arginine, and γ-aminobutyric acid). Furthermore, our
The SCFA concentrations exhibited dose-dependent elevations with an increasing Pa JY062 dosage, reaching maximal levels in the Pa_5 group (Figure 8F). Notably, PaJY062 had the greatest effect on the acetate concentration, increasing it by 120.19 ± 6.53 µg/mL compared with 857.97 ± 19.67 µg/mL in the control group, which was consistent with the diversity of the intestinal microbiota. Simultaneously, the incorporation of PaJY062 exerted a considerable influence on the propionic acid and butyric acid levels.
3.8. PaJY062 Contained a Variety of Beneficial Ingredients
The components of Pa JY062 are elaborated on in Table 3, wherein 14 substances exhibited a concentration exceeding 100,000 ng/mL in addition to the metabolites of tryptophan (specifically, 3-indolactic acid, indole-3-carboxaldehyde, tryptophol, pyridoxal hydrochloride, arginine, and γ-aminobutyric acid). Furthermore, our findings reveal the presence of hydrolysis products of αs-casein and β-lactoglobulin, such as L-glutamic acid, alanine, lysine, tyrosine, phenylalanine, histidine, and arginine, within PaJY062.
Table 3. Components of in Pa JY062.
Substance Substance Type Chemical Formula Content (ng/mL) Dihydroxyacetone phosphate Phosphoric acids C3H7O6P 1,199,244
N-Acetyl-D-Galactosamine Amines C8H15NO6 457,323.6
α-Ketoglutaric Acid Organic acid and its derivatives C5H6O5 384,721.2 rac Normetanephrine Hydrochloride
Hormones and hormone-related compunds
C9H14ClNO3 275,776.8 N-Acetylneuraminic Acid Amino acid derivatives C11H19NO9 274,082.4
2-Methyllactic acid Organic acid and its derivatives C4H8O3 248,861.4
Pantothenic acid Sugars C9H17NO5 245,755.8 L-Pyroglutamic acid Amino acids C5H7NO3 157,103.4
L-Glutamic acid Amino acids C5H9NO4 150,073.8
Choline alfoscerate LPC C8H20NO6P 140,098.2 Glutaric acid Organic acid and its derivatives C5H8O4 118,312.2 L-Leucic acid Amino acids C6H12O3 117,873
L-Alanine Amino acids C3H7NO2 107,682 N-Acetyl-L-glutamic acid Amino acid derivatives C7H11NO5 104,548.2
Indolelactic acid Indole and its derivatives C11H11NO3 3846.162 Indole-3-Carboxaldehyde Indole and its derivatives C9H7NO 18.5718
Tryptophol Indole and its derivatives C10H11NO 438.7266 Pyridoxal hydrochloride CoEnzyme and vitamins C8H10ClNO3 2699.274
Arginine Amino acids C6H14N4O2 19,382.1
γ-Aminobutyric acid Organic acid and its derivatives C4H9NO2 59,846.52
L-Glutamic acid Amino acids C5H9NO4 150,073.80
Lysine Amino acids C6H14N2O2 13,724.82 Tyrosine Amino acids C9H11NO3 77,773.2
Phenylalanine Amino acids C9H11NO2 81,640.2 Histidine Amino acids C6H9N3O2 85,330.8
4. Discussion
Inflammatory bowel disease (IBD) and related intestinal pathologies are pathologically defined by compromised intestinal epithelial barrier integrity and macrophage hyperactivation. The Caco-2 intestinal epithelial model has been extensively employed for investigating intestinal pathophysiology, drug transport mechanisms, and colitis-related pathogenesis. Concurrently, RAW264.7 macrophages serve as pivotal mediators of innate immunity through the secretion of immunoregulatory cytokines that orchestrate adaptive immune activation. Our optimized co-culture system recapitulates disease-relevant cellular interac-
tions while overcoming the physiological limitations of monoculture systems, providing a cost-efficient platform for simulating in vivo microenvironments.
The current study was predicated on the Caco-2/RAW264.7 intestinal model induced by LPS to systematically investigate the anti-inflammatory properties of postbiotics and their protective effects on the intestinal barrier. TEER reflected the integrity of tight junctions and the overall barrier function among epithelial cells. A higher TEER value signified a more robust barrier function and reduced permeability. FITC-dextran (4 kDa) is closer to physiological molecules that are small in size and can more easily pass through damaged barriers. TEER and FITC-dextran permeability can accurately reflect the changes in barrier function under different physiological or pathological conditions. We observed an imbalance in the interaction between Caco-2 cells and RAW264.7 macrophages, leading to sustained inflammation and tissue damage, providing insights into the disease and potential therapeutic targets. Our findings indicate that PaJY062 exhibited no toxicity towards RAW264.7 and Caco-2 cells, and it effectively alleviated the LPS-induced increase in TEER and the FITC-dextran permeability of the intestinal barrier. Similarly to the effects of PaJY062, Lactobacillus plantarum 1.0386 postbiotics could improve transepithelial electrical resistance enhance and mitigate the disruption of paracellular permeability, and enhance the tight junction in Caco-2 [30]. Heat-killed Enterococcus faecium BGPAS1-3 possessed the capability to protect against tight junction disruption in differentiated Caco-2 monolayers challenged by L. monocytogenes ATCC 19111 [31]. Postbiotic muramyl dipeptide can decrease apoptosis and mitigate increases in intestinal barrier paracellular permeability by LPS exposure in Caco-2 cells [28]. Postbiotics, compared with the LPS/pathogen, demonstrated effective preservation of intestinal barrier integrity in Caco-2 models by elevating TEER and mitigating FITC-dextran permeability.
The protective effect of postbiotics on the intestinal barrier was further evidenced by their capacity to restore microvillus architecture. We also observed that the microvilli of the intestinal barrier progressively regained their brush-like structure and tight junctions under the influence of PaJY062. The restoration of the brush border structure promoted the recovery of the absorption function of intestinal epithelial cells, enhanced nutrient absorption capacity, helped rebuild the intestinal barrier function, and reduced the invasion of pathogens. A similar phenomenon was noted in postbiotics 1.0386-Slp [32]. Tight junctions regulated cell bypass permeability and maintained cell polarity. The adhesive junction was located below the tight junction of epithelial cells, which enabled the connection between two cells by interacting with E-cadherin, α, β, and γ-catenin [33,34]. Postbiotics (butyrate and active vitamin D3) enhanced the expression of ZO-1 in the cecum of mice infected with Salmonella [35]. However, the expression of claudin did not exhibit a significant decrease in Caco-2 cells infected with Listeria monocytogenes ATCC 19111. The mRNA expression of occludin was regulated by heat-killed Enterococcus faecium BGPAS1-325. The fermentation of cow’s milk using Lactobacillus paracasei CBAL74 demonstrated a protective effect that enhanced occludin and ZO-1 expression and significantly enhanced E-cadherin expression on Caco-2 cells [36]. Consistent with other postbiotics, Pa JY062 demonstrated efficacy in enhancing the stability of the intestinal barrier and in managing intestinal inflammatory diseases caused by LPS. These findings from different postbiotics suggest that postbiotics have the potential to maintain intestinal health by protecting the intestinal barrier.
Impaired integrity of the intestinal barrier triggered a cascade of intestinal inflammation. This study revealed that Pa JY062 significantly reduced the release of pro-inflammatory cytokines, including IL-6, IL-17a, TNF-α, IL-1β, IL-12p40, and IL-23p19, while simultaneously enhancing the production of IL-10 and TGF-β, as well as augmenting the phagocytic capacity of RAW264.7 cells. These findings are consistent with previous studies that Saccharomyces boulardii and postbiotics significantly diminished the release of pro-inflammatory
factors such as IL-1β, IL-6, IL-17a, and TNF-α induced by DSS while enhancing the secretion of IL-10 [37]. The collaboration between TNF-α, IL-1, and IL-6 facilitated the migration of immune cells to the site of inflammation. The overexpression of IL-17a elicited the production of TNF-α, IL-6, and IL-1β, thereby exacerbating the severity of inflammation. Conversely, a reduction in IL-17a diminished the synthesis of these inflammatory mediators while simultaneously modulating Treg/Th17 balance by augmenting the proportion of Treg cells. Treg cells alleviated inflammation by inhibiting the activity of effector T cells and indirectly by secreting anti-inflammatory factors IL-10 and TGF-β, hence inhibiting the inflammatory response. IL-23 shared a common p40 subunit with IL-12 [38], while the p19 subunit specifically influenced IL-23. IL-12 stimulated the Th1 response, whereas IL-23 promoted the Th17 response; both disrupted intestinal homeostasis, accelerated inflammation, and played an essential role in the progression of intestinal inflammation. Heat-killed Companilactobacillus crustorum MN047 substantially reversed TNF-α and IL-6 in DSS induced colitis mice [39]. Limosilactobacillus reuteri DS0384 protected intestinal epithelium subjected to injury induced by IFNγ and TNFα in a human intestinal organoid model [40]. In summary, therapeutic targeting of the Th17/Treg immune axis was a key strategy to improve intestinal inflammation, and postbiotics regulated this immune network through multiple targets, providing a potential solution for the treatment of inflammatory diseases associated with intestinal barrier damage.
Given that the anti-inflammatory effect of Pa JY062 was closely related to its gastrointestinal digestion and absorption and its effect on intestinal flora, we next analyzed the effects of Pa JY062 on the intestinal microbiota and short-chain fatty acids in vivo; this research also encompassed in vitro digestion and fermentation experiments. Pa_5 (PaJY062,
- 5 mg/mL) exerted a better influence on the α diversity of the gut microbiota, especially for the growth of beneficial bacteria, such as Limosilactobacillus, Lactobacillus, Pediococcus, and Lacticaseibacillus. Limosilactobacillus, Lactobacillus, Pediococcus, and Lacticaseibacillus produced lactic acid, acetic acid, lactobacillus, and other substances through in vivo fermentation, which played the role of inhibiting pathogenic bacteria. This finding is consistent with Mu’s research, which found that postbiotics have more Lactobacillus, Lactobacillus sp. ASF360, and Lactobacillus vaginalis in the fecal microbiota of groups M and H [41]. Through the restoration of the increased abundance of Lactobacillus and Rikenellaceae, along with a decrease in the prevalence of Turicibacter and Escherichia-Shigella, Saccharomyces boulardii BR14 mitigated colitis [42]. The ADR-159 postbiotics exerted a beneficial effect on inflammation induced by Citrobacter [43]. Lactobacillus parabuchneri postbiotics MF2103 enriched the diversity of microbiota within the Faecalibacterium enterotype [44], while Guo et al. found that postbiotic intervention not only increased beneficial gut bacteria such as Dysosmobacter welbionis and Faecalibacterium prausnitzii, resulting in elevated concentrations of acetic acid, propionic acid, butyric acid, caproic acid, and valeric acid, but also reduced potential pathogens like Megamonas funiformis [45]. This evidence indicates that postbiotics reshaped gut microbes, promoted the production of SCFAs, and then regulated the immune balance and barrier function, thereby achieving the initial effect of alleviating intestinal inflammation such as colitis.
Furthermore, a detailed analysis of the specific components of Pa JY062 was conducted to elucidate which constituents contribute to its protective role in intestinal healthpromoting properties. PaJY062 comprises a variety of beneficial components, including metabolites of tryptophan (3-indolactic acid, indole-3-carboxaldehyde, and tryptophol), pyridoxal hydrochloride, arginine, and γ-aminobutyric acid. Studies showed that 3indolactic acid (IAA) mitigated DSS-induced colitis in mice by modifying the gut microbiome. In the group treated with IAA, there was a notable increase in the abundance of Bifidobacterium pseudolongum [46]. 3-carboxaldehyde effectively protected against colon
length shortening and damage induced by DSS in the colon, notably reducing the severity of inflammation. The production of inflammatory factors of TNF-α, IL-6, and IL-1β was significantly reduced under 3-IAld treatment. 3-carboxaldehyde provided effective protection against the shortening of the colon length and damage caused by DSS, significantly diminishing the severity of inflammation. The production of inflammatory factors such as TNF-α, IL-6, and IL-1β was markedly reduced when treated with 3-IAld both in vivo and in vitro [47]. Samantha A. Scott discovered that three gut microbially synthesized compounds—indole-3-ethanol, indole-3-pyruvate, and indole-3-aldehyde—enhance the integrity of the intestinal barrier and provide protection against inflammation associated with IBDs [48]. Pyridoxal hydrochloride (VB6) intake alleviated IBD in mice [49]. The expression of Arg1 was found to be associated with the level of inflammation in intestinal tissues from patients with IBD [50]. Furthermore, our findings reveal the presence of hydrolysis products of αs-casein and β-lactoglobulin, such as L-glutamic acid, alanine, lysine, tyrosine, phenylalanine, histidine, and arginine, within PaJY062. This suggests that the allergenic components found in milk are transformed into easily absorbable amino acids via fermentation. Consequently, PaJY062 offers therapeutic benefits for patients suffering from ulcerative colitis.
While acknowledging the inherent limitations of in vitro models in replicating physiological complexity (e.g., neuroendocrine regulation, host-microbiome crosstalk, and systemic immune interactions), we initiated complementary in vivo validation studies using a dextran sulfate sodium (DSS)-induced ulcerative colitis model to validate Pa JY062′s therapeutic efficacy under physiologically relevant conditions.
Despite these limitations, we demonstrated that Lactobacillus paracasei JY062 postbiotics could effectively sustain intestinal health. Mechanistically, our findings indicate that this protective effect primarily arose from the presence of small-molecule active ingredients with anti-inflammatory activity and good absorption, which collaboratively functioned to regulate inflammation, bolster the epithelial barrier, and modulate the intestinal microbiota and short-chain fatty acids, thereby enhancing the structure of the colonic mucosa. Lactobacillus paracasei JY062 postbiotic is a skimmed milk-based postbiotic that can be well digested and absorbed by the human body. This positions it as a promising therapeutic agent for the alleviation of intestinal inflammation.
5. Conclusions
This study illustrates that the postbiotic Pa JY062 can effectively enhance the intestinal health of the Caco-2/RAW264.7 co-culture system by alleviating LPS-induced intestinal barrier damage and intestinal inflammation. In particular, it reduces the FITC-dextran permeability of the intestinal barrier, restores the microvillus structure, and enhances the mRNA expression levels of ZO-1, claudin-1, occludin and E-cadherin. It promotes the restoration of Th17/Treg balance by reducing pro-inflammatory factors and enhancing the secretion of anti-inflammatory factors, and it also promotes the increase in beneficial intestinal bacteria and SCFAs. Its intestinal protective effect is mainly due to its presence of multiple bioactive components, such as tryptophan metabolites, GABA, VB6, etc. This study provides scientific value for the widespread application of more probiotic-derived postbiotics by clarifying the beneficial effects of PaJY062 in the intestine. This study provides a theoretical basis for the widespread application of probiotic-derived postbiotics. However, current research is still mainly focused on in vitro studies, and the physiological complexity of the host cannot be fully simulated, which may limit the widespread application of the commercialization process of postbiotics. Therefore, we need to further conduct in vivo studies on Pa JY062 to alleviate colitis to accelerate the further application and promotion of Pa JY062 in the field of intestinal health.
Supplementary Materials: The following supporting information can be downloaded at: https:// www.mdpi.com/article/10.3390/nu17071272/s1, Table S1: RNA purity and concentration; Table S2: Genomic DNA removal reaction; Table S3. Reverse transcription reaction; Table S4: PCR reaction system; Table S5: Real-Time PCR Reaction Procedure.
Author Contributions: Conceptualization, J.G.; methodology, Y.Z. (Ying Zhao); software, W.G.; validation, J.G, Y.Z. and Y.S.; formal analysis, J.G.; investigation, J.G.; resources, Q.Z.; data curation, W.Z.; writing—original draft preparation, J.G.; writing—review and editing, Y.Z. (Ying Zhao); visualization, Y.Z. (Yu Zhang); supervision, Y.J.; project administration, Y.J.; funding acquisition, W.Z. All authors have read and agreed to the published version of the manuscript.
Funding: This research was supported by the National Key R&D Program of China (2022YFF1100605). Institutional Review Board Statement: The animal experiment was approved by the Laboratory Animal Welfare and Ethics Committee of Northeast Agricultural University (#NEAUEC20230422) and was conducted according to the Guide for the Care and Use of Laboratory Animals (China).
Informed Consent Statement: Not applicable. Data Availability Statement: The data in the project are still being collected, but all data used in this study are available by contacting the authors.
Acknowledgments: The authors wish to express their gratitude to the anonymous reviewers and the editor for their insightful comments on a prior version of this manuscript. Thanks for the National Key R&D Program of China (2022YFF1100605).
Conflicts of Interest: The authors declare no conflicts of interest.
Figures
Tables
Table 1
Table 2
Table 3
Table 4
Table 5
Table 6
Table 7
Table 8
Used In Evidence Reviews
Similar Papers
The British journal of nutrition · 2002
The immune system: a target for functional foods?
Public health nutrition · 2000
The role of vitamins in the prevention and control of anaemia.
Journal of Alzheimer's disease : JAD · 2018
Homocysteine and Dementia: An International Consensus Statement.
European journal of obstetrics, gynecology, and reproductive biology · 2012
Influence of mineral and vitamin supplements on pregnancy outcome.
Seminars in thrombosis and hemostasis · 2000
Vitamin supplements and cardiovascular risk: review of the randomized trials of homocysteine-lowering vitamin supplements.
Nutrients · 2016