Forschungsprozess
153 Abbildungen aus begutachteter Forschung
Skin hydration measurements in human subjects receiving oral eggshell membrane supplementation are tracked over the study period.
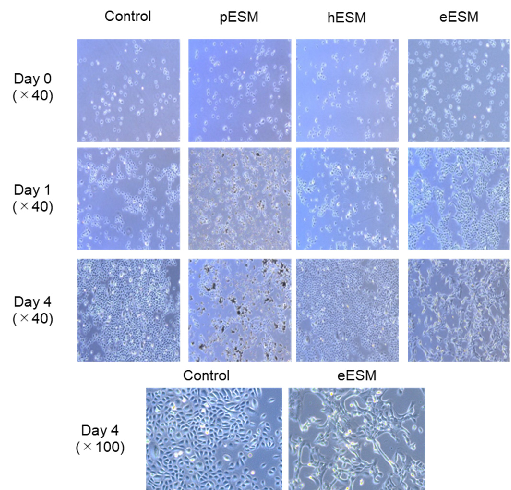
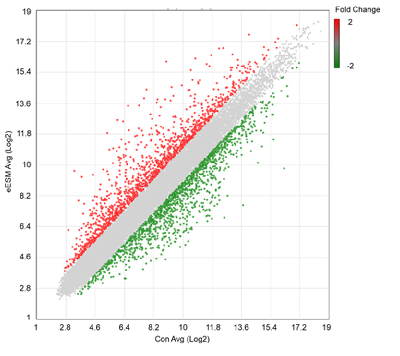
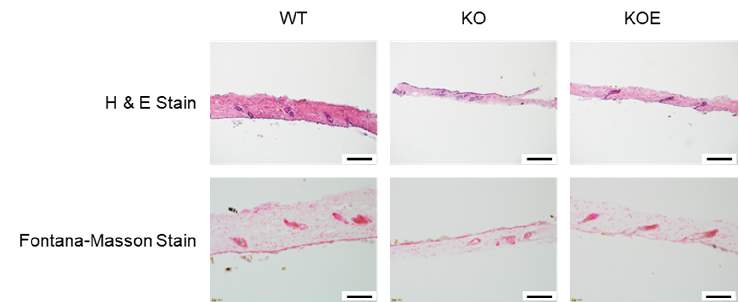
Effects of Eggshell Membrane on Keratinocyte Differentiation and Skin Aging In Vitro …
Histological sections of reconstructed skin models show improved epidermal architecture in eggshell membrane-treated constructs.
Effects of Eggshell Membrane on Keratinocyte Differentiation and Skin Aging In Vitro …
Molecular pathway analysis related to eggshell membrane effects on skin aging, depicting signaling cascades involved in keratinocyte differentiation or senescence.
Effects of Eggshell Membrane on Keratinocyte Differentiation and Skin Aging In Vitro …
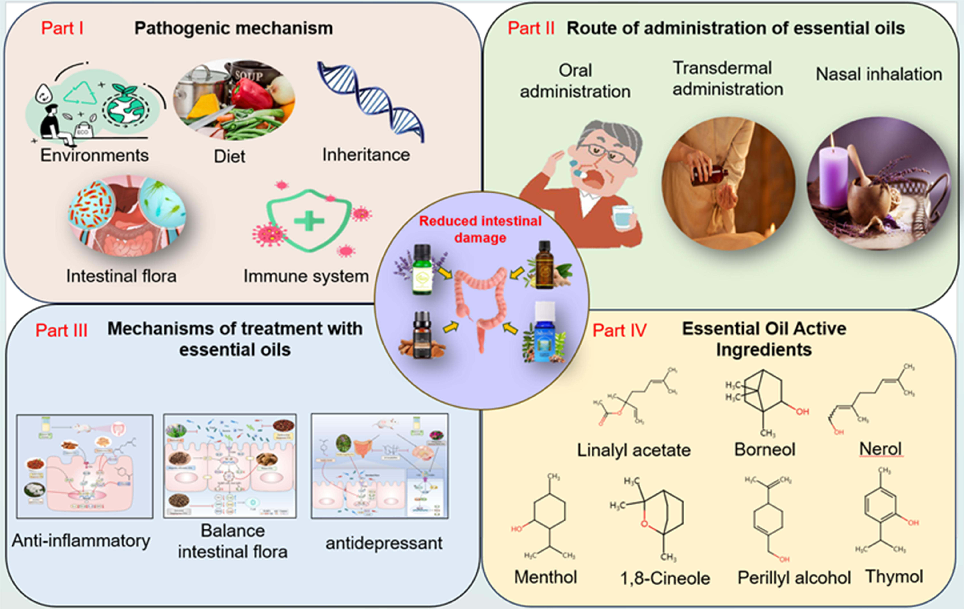
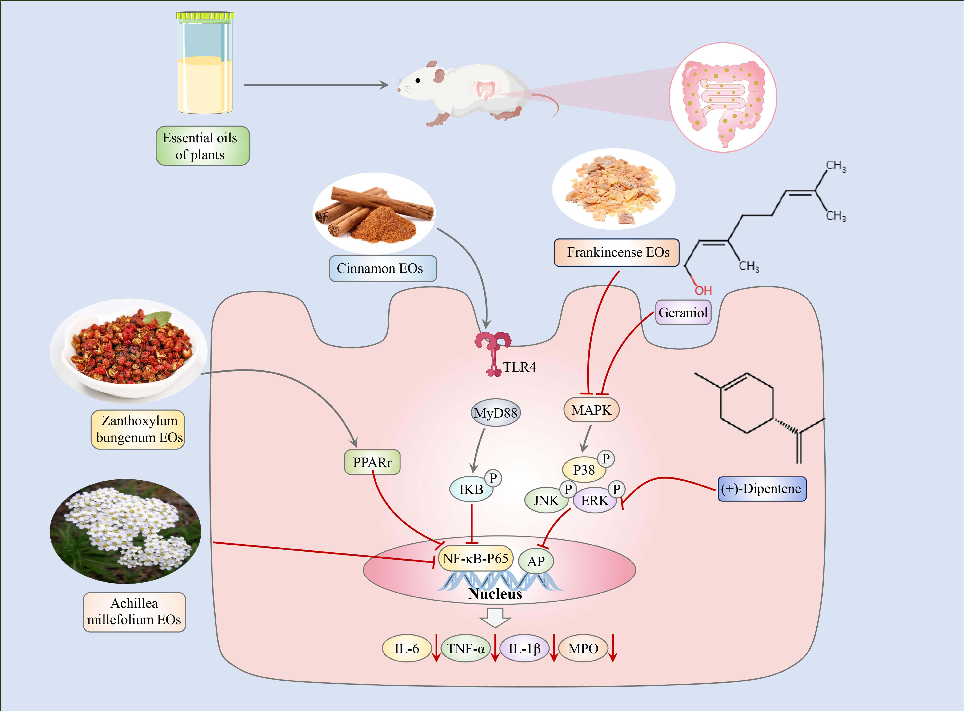
Graphical Abstract
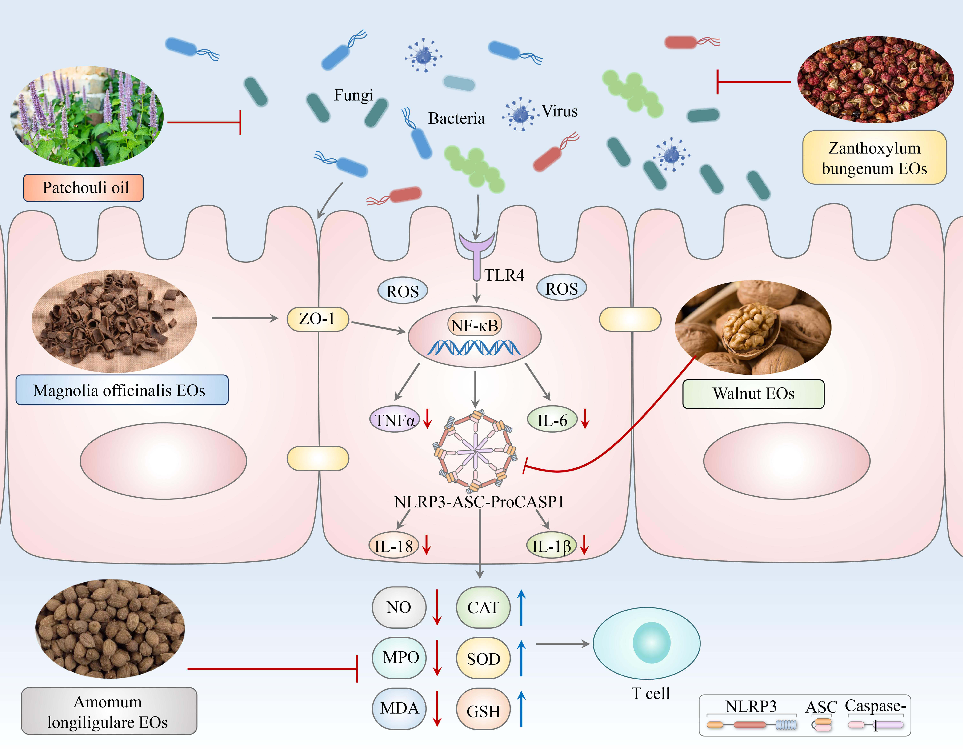
Therapeutic Potential of Essential Oils Against Ulcerative Colitis: A Review.
Therapeutic Potential of Essential Oils Against Ulcerative Colitis: A Review.
Therapeutic Potential of Essential Oils Against Ulcerative Colitis: A Review.
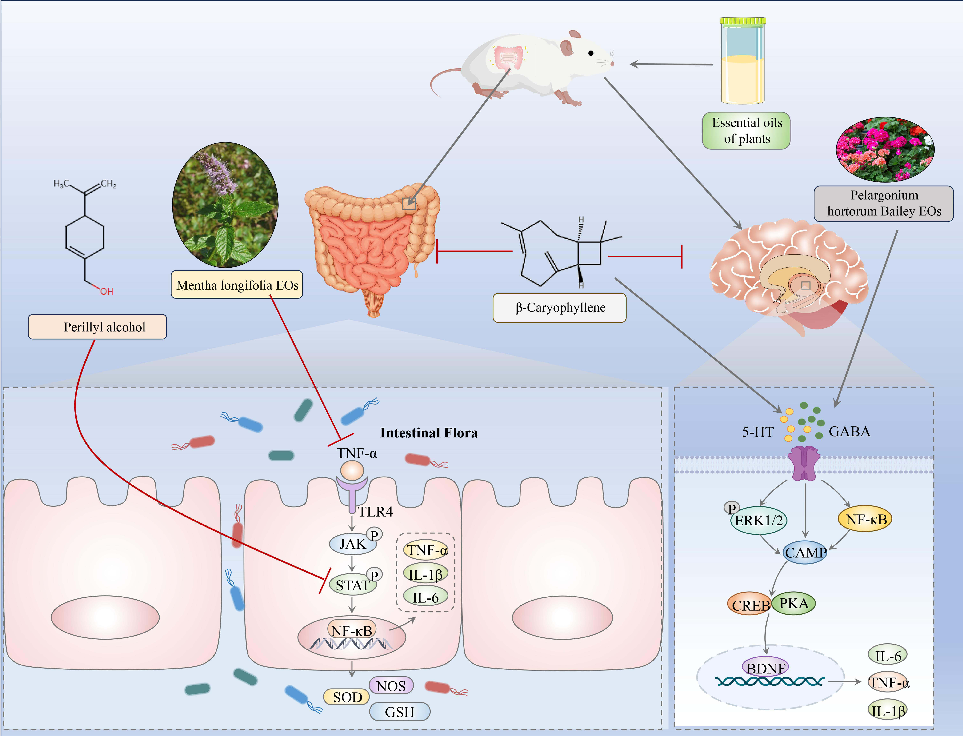
Therapeutic Potential of Essential Oils Against Ulcerative Colitis: A Review.
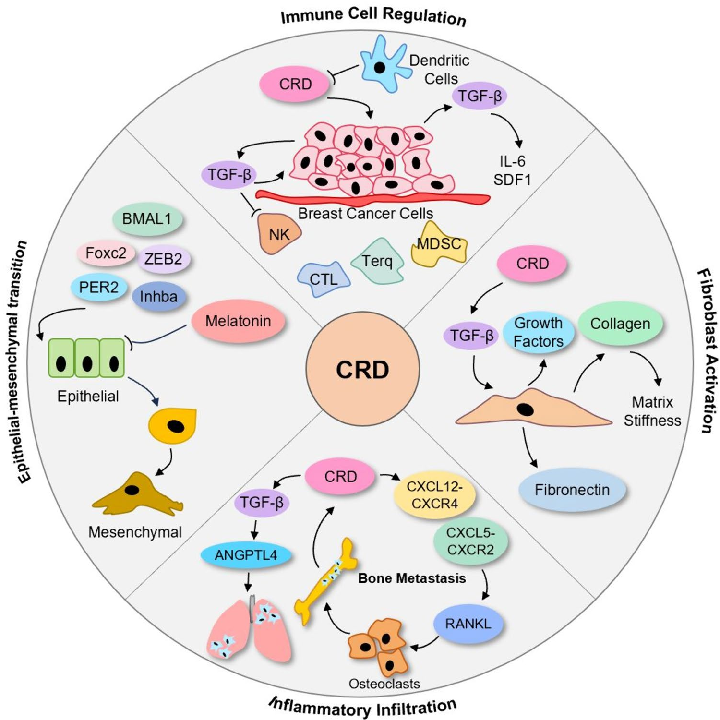
Circadian rhythms and breast cancer: from molecular level to therapeutic advancements.
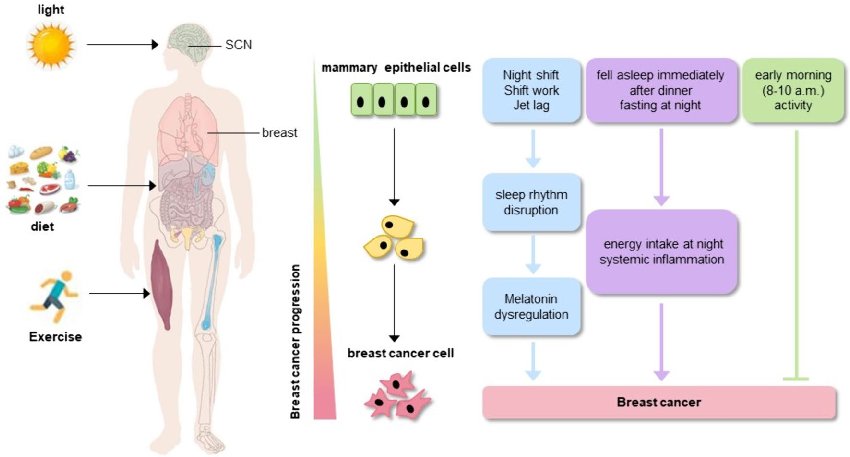
Circadian rhythms and breast cancer: from molecular level to therapeutic advancements.
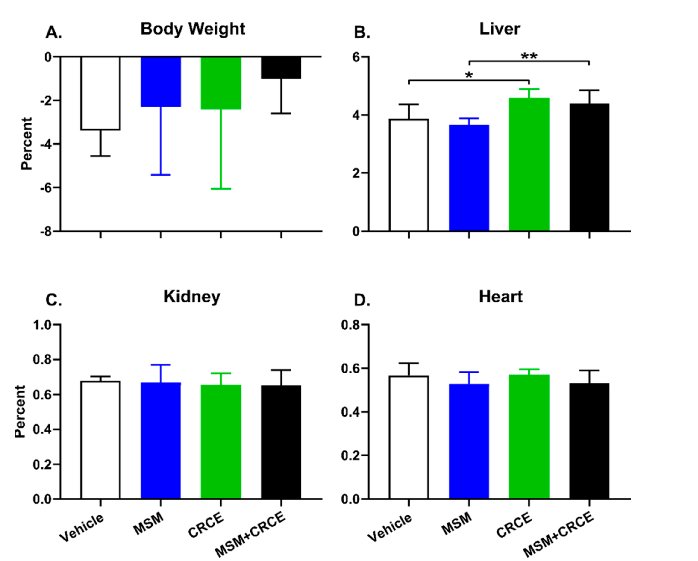
Extended molecular analysis data examining the effects of CBD-rich cannabis extract and MSM on cellular detoxification pathways. The results contribute to understanding the safety implications of co-supplementation.
Safety and Molecular-Toxicological Implications of Cannabidiol-Rich Cannabis Extract and Methylsulfonylmethane Co-Administration.
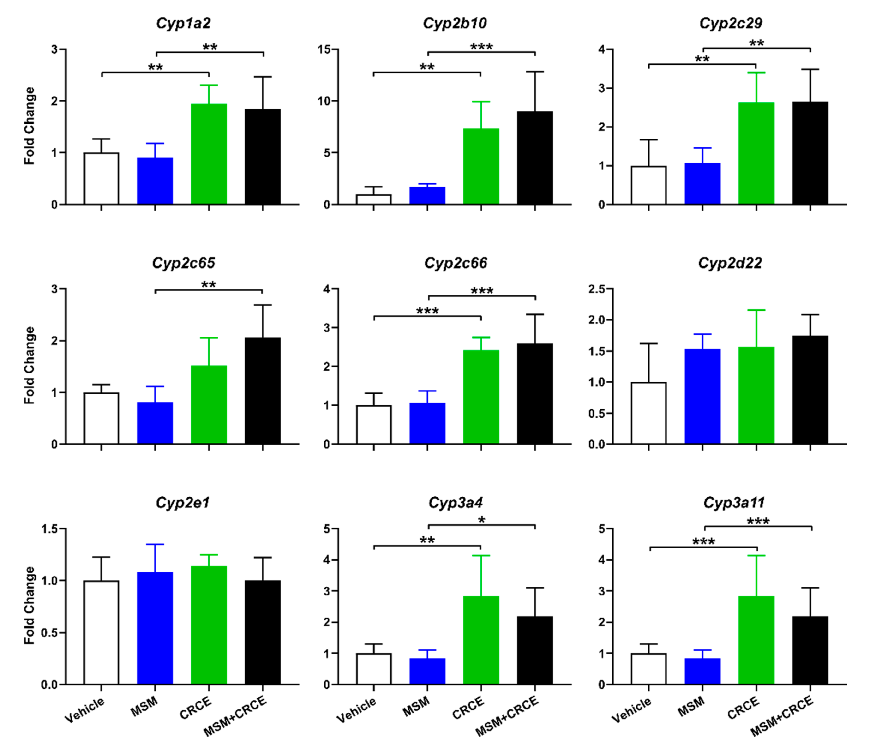
Intrahepatic expression of cytochrome P450 enzymes in response to MSM, CBD-rich cannabis extract (CRCE), or their combination. Alterations in CYP450 expression are critical for assessing drug-supplement interaction potential and metabolic safety.
Safety and Molecular-Toxicological Implications of Cannabidiol-Rich Cannabis Extract and Methylsulfonylmethane Co-Administration.
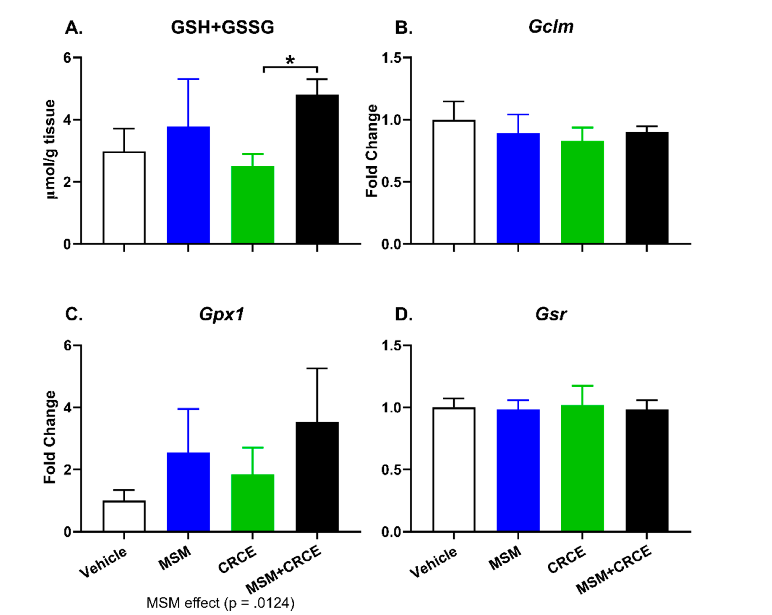
Effects of MSM, CBD-rich cannabis extract, and their combination on intrahepatic glutathione synthesis and related gene expression. Glutathione is a key antioxidant, and changes in its production may indicate shifts in the liver's oxidative stress response.
Safety and Molecular-Toxicological Implications of Cannabidiol-Rich Cannabis Extract and Methylsulfonylmethane Co-Administration.
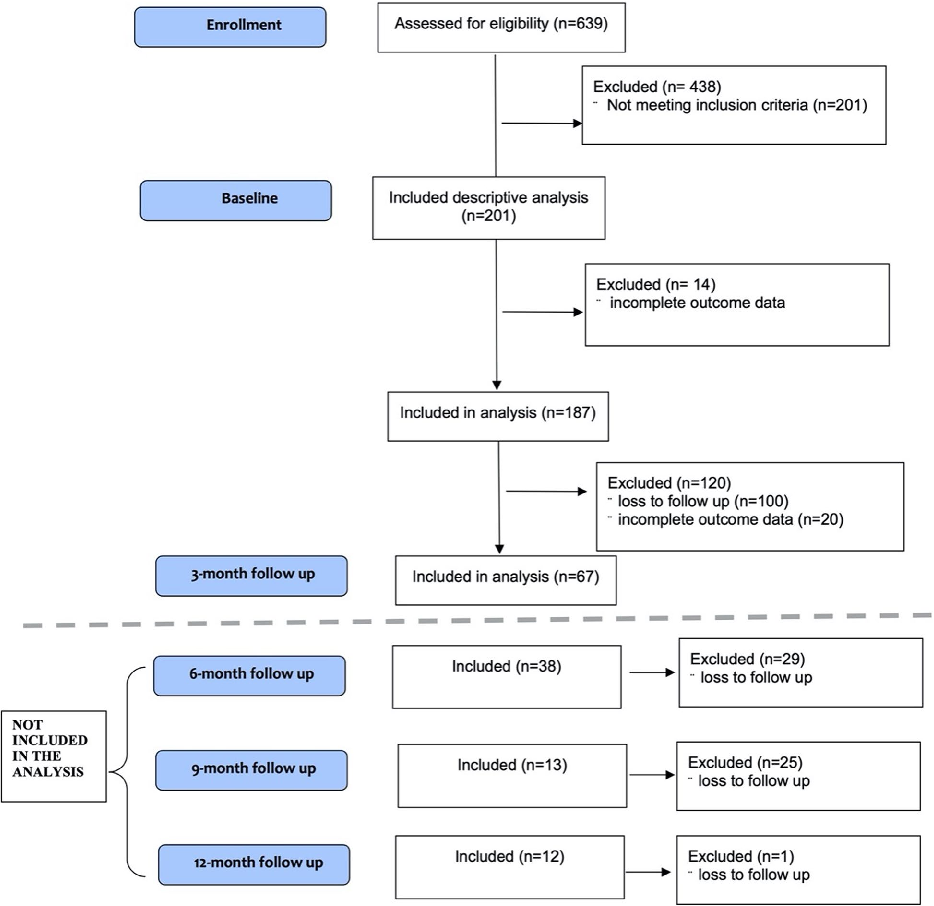
Fig. 1 CONSORT flow diagram.
Medical cannabis authorization patterns, safety, and associated effects in older adults.
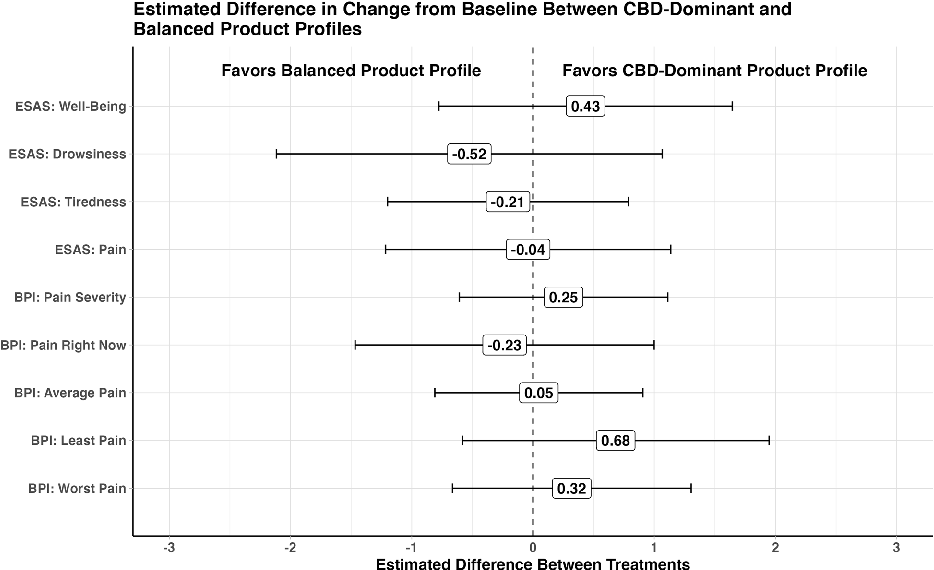
Fig. 2 Estimated difference in change from baseline between CBD-dominant and balanced product profiles
Medical cannabis authorization patterns, safety, and associated effects in older adults.
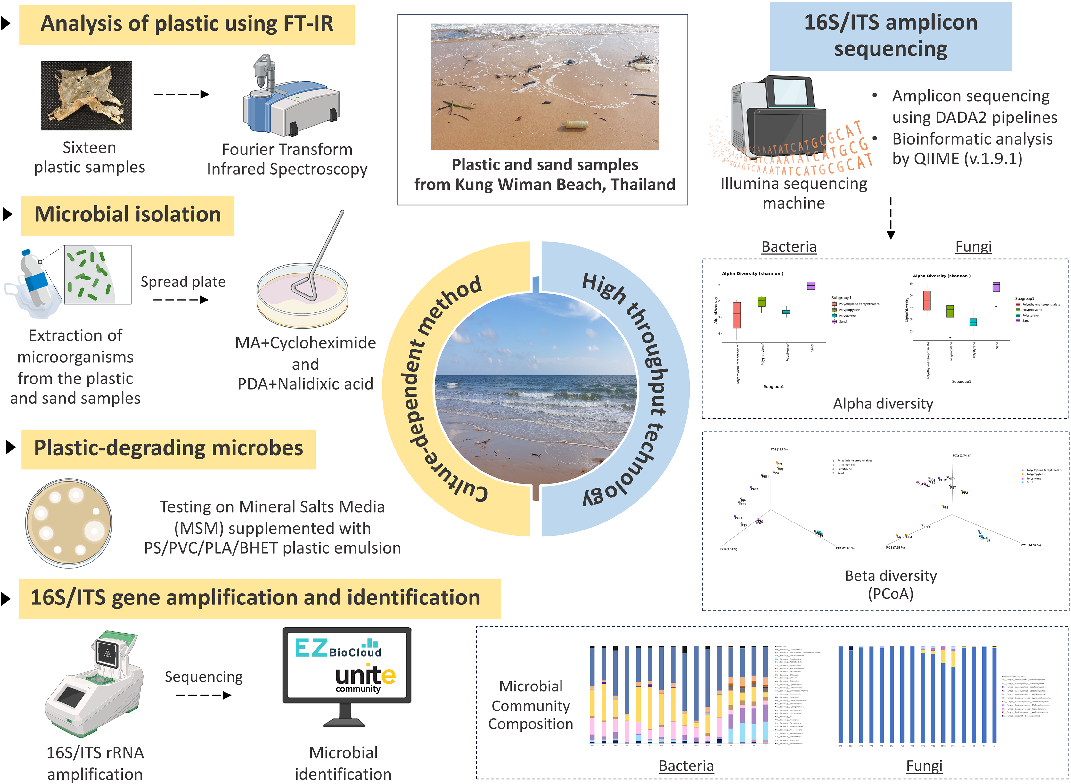
Experimental design schematic for the comparative study of plastisphere microbial communities at Kung Wiman beach, created with BioRender to illustrate the sampling and analysis workflow.
The comparative plastisphere microbial community profile at Kung Wiman beach unveils potential …
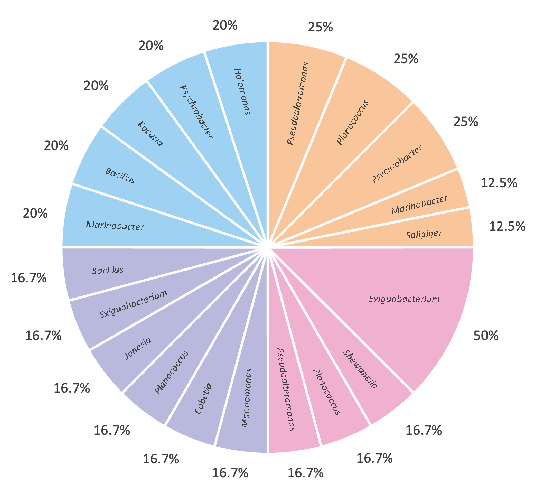
Microbial community analysis data from the comparative plastisphere study at Kung Wiman beach, characterizing microorganisms colonizing plastic debris in the marine environment.
The comparative plastisphere microbial community profile at Kung Wiman beach unveils potential …
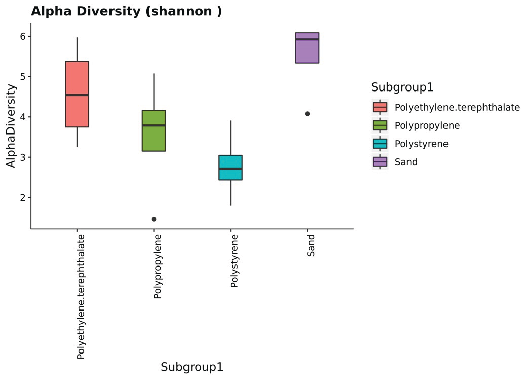
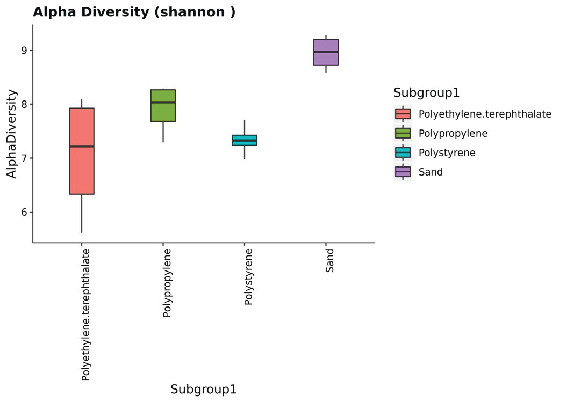
Shannon diversity indices representing alpha diversity of microbial isolates from plastisphere communities at Kung Wiman beach, comparing diversity across different plastic substrate types.
The comparative plastisphere microbial community profile at Kung Wiman beach unveils potential …
Microbial community analysis data from the comparative plastisphere study at Kung Wiman beach, characterizing microorganisms colonizing plastic debris in the marine environment.
The comparative plastisphere microbial community profile at Kung Wiman beach unveils potential …
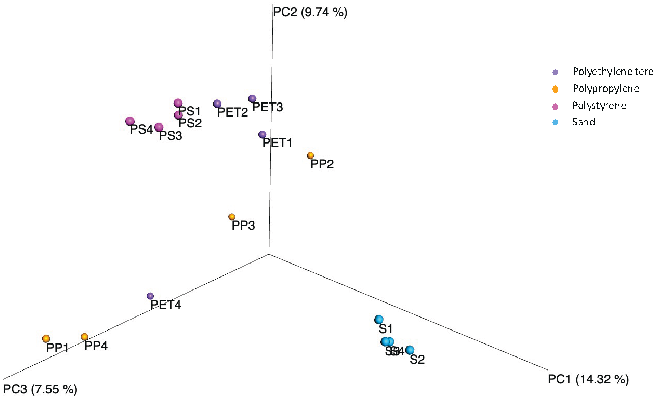
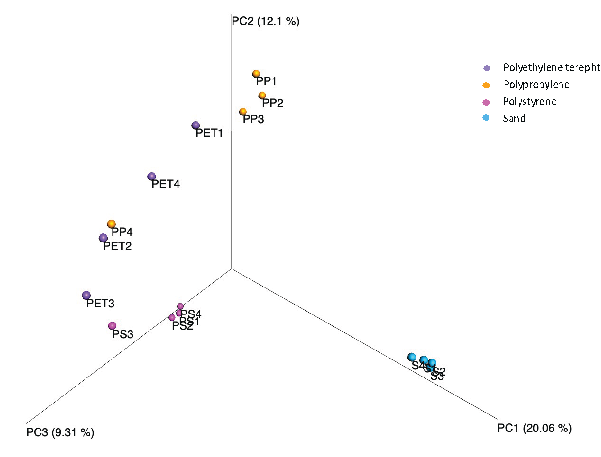
Principal coordinate analysis (PCoA) based on Bray-Curtis dissimilarities, comparing plastisphere microbial community composition across different plastic substrates collected from Kung Wiman beach.
The comparative plastisphere microbial community profile at Kung Wiman beach unveils potential …
Microbial community analysis data from the comparative plastisphere study at Kung Wiman beach, characterizing microorganisms colonizing plastic debris in the marine environment.
The comparative plastisphere microbial community profile at Kung Wiman beach unveils potential …
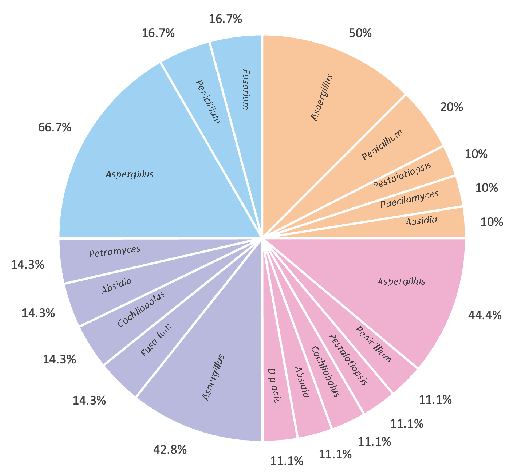
Microbial community analysis data from the comparative plastisphere study at Kung Wiman beach, characterizing microorganisms colonizing plastic debris in the marine environment.
The comparative plastisphere microbial community profile at Kung Wiman beach unveils potential …
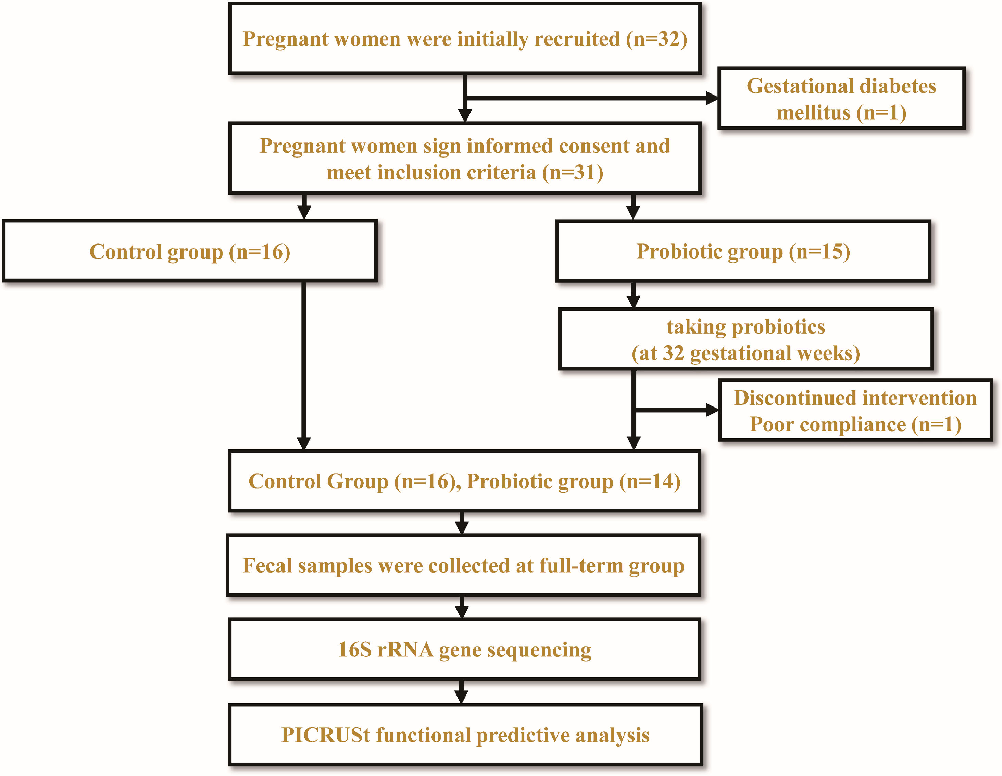
Gut microbiota diversity analysis from pregnant women receiving probiotic supplementation, assessing changes in microbial community composition and functional capacity.
Effect of probiotic administration during pregnancy on the functional diversity of the …
Gut microbiota diversity analysis from pregnant women receiving probiotic supplementation, assessing changes in microbial community composition and functional capacity.
Effect of probiotic administration during pregnancy on the functional diversity of the …
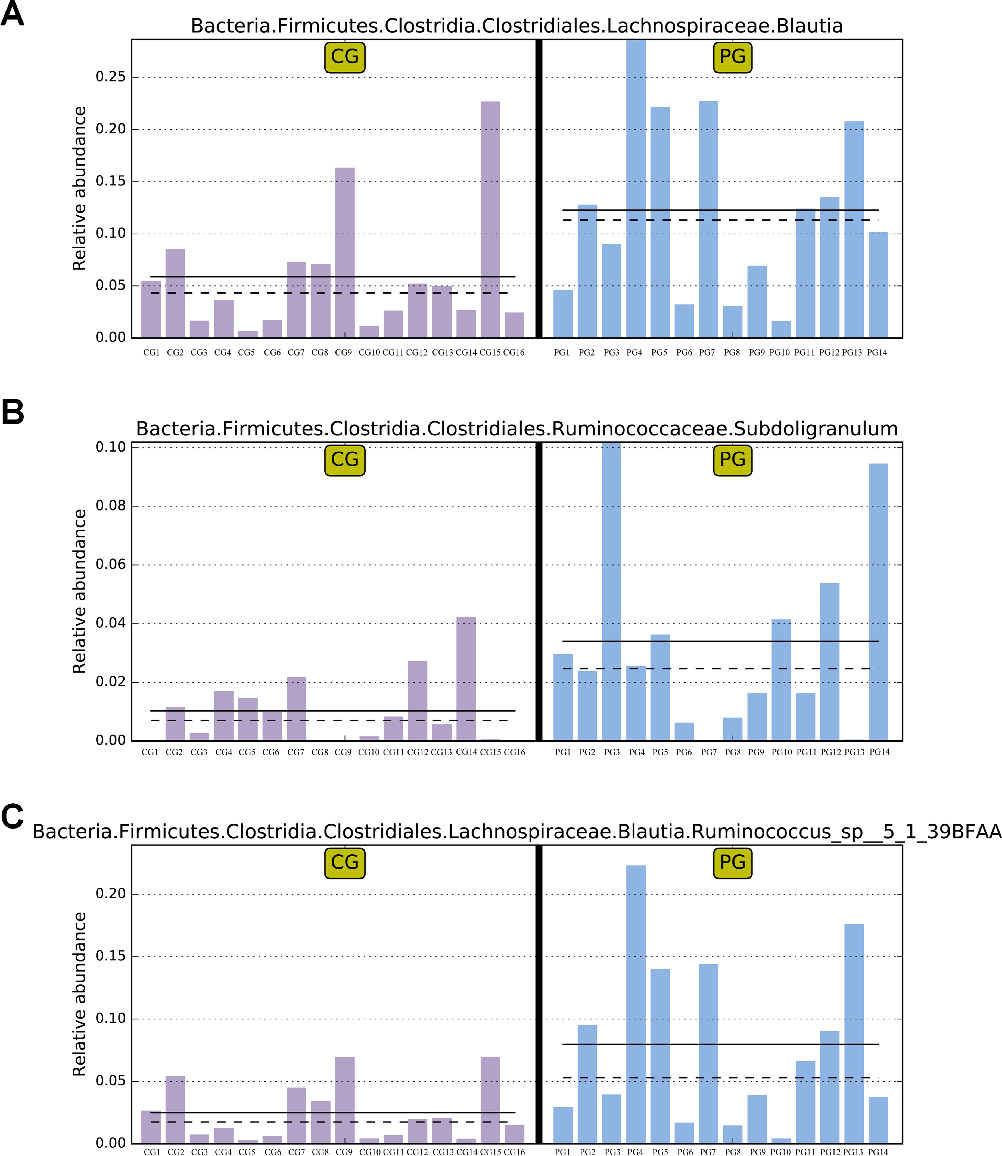
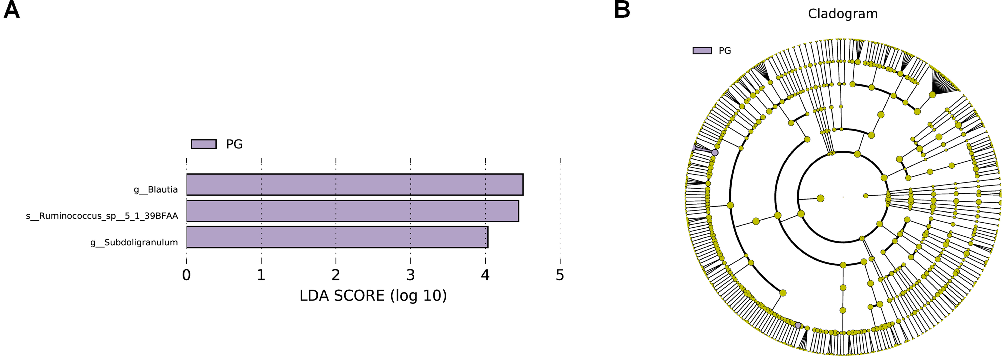
Extended microbiome analysis data from the pregnancy probiotic trial, examining functional diversity shifts in the gut microbiota of mothers and their offspring.
Effect of probiotic administration during pregnancy on the functional diversity of the …
Seite 5 von 7