Forschungsprozess
153 Abbildungen aus begutachteter Forschung
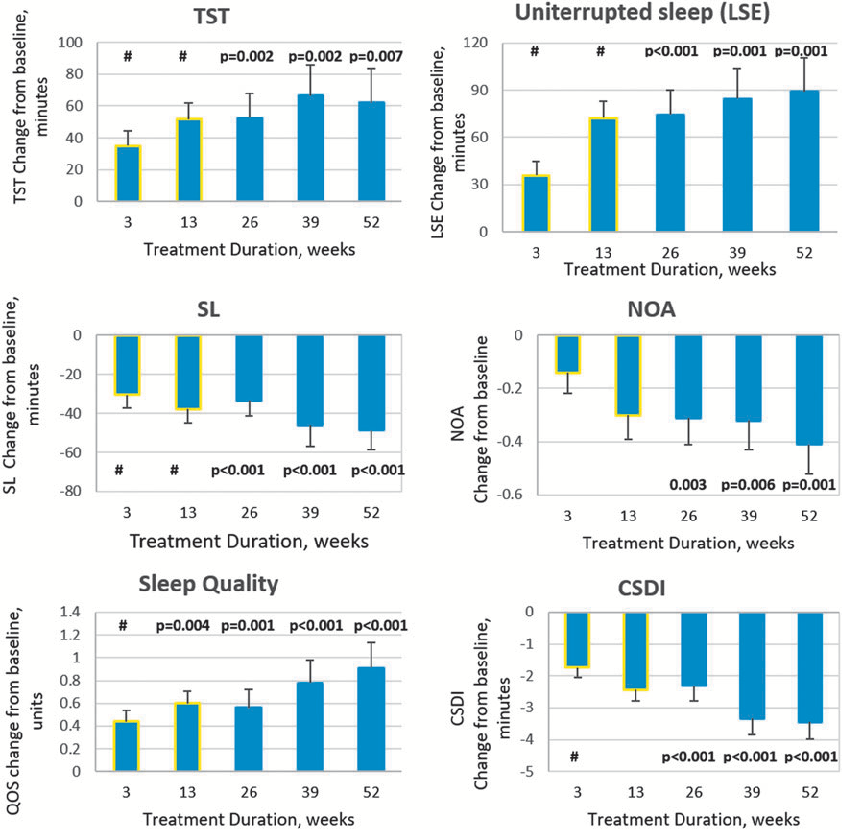
Efficacy outcomes showing changes in sleep parameters over the extended treatment period with pediatric prolonged-release melatonin in children with ASD. Long-term data indicate sustained improvements in sleep onset latency and total sleep time.
Long-Term Efficacy and Safety of Pediatric Prolonged-Release Melatonin for Insomnia in Children …
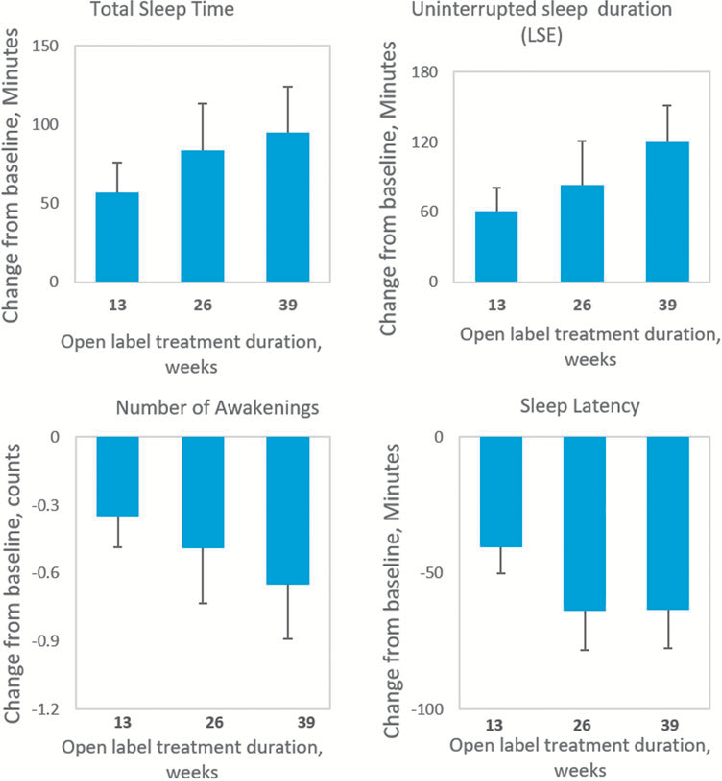
Safety assessment data from the open-label extension of PedPRM treatment in pediatric patients with autism spectrum disorder. Adverse event profiles suggest the prolonged-release melatonin formulation maintained an acceptable safety profile over the extended study period.
Long-Term Efficacy and Safety of Pediatric Prolonged-Release Melatonin for Insomnia in Children …
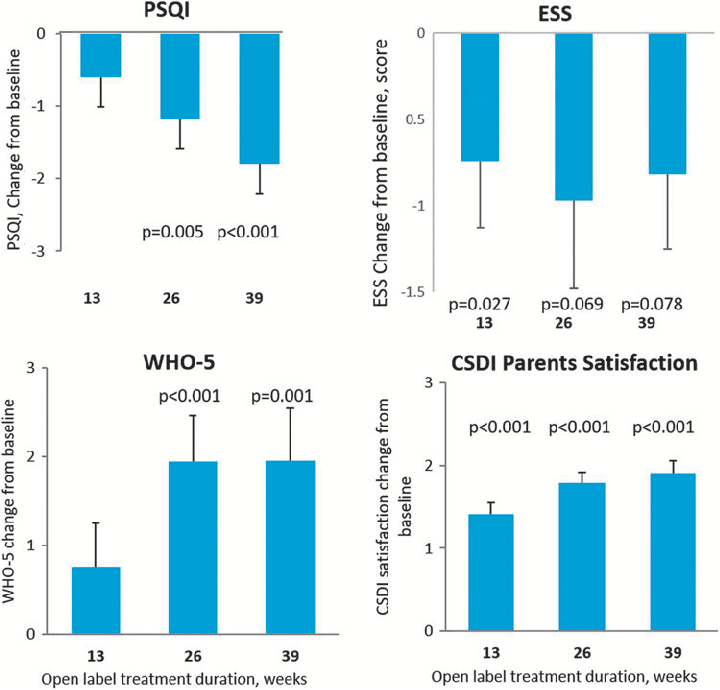
Summary of sleep quality measures or caregiver-reported outcomes during long-term PedPRM administration in children with ASD and comorbid insomnia. Results suggest continued therapeutic benefit with nightly melatonin use.
Long-Term Efficacy and Safety of Pediatric Prolonged-Release Melatonin for Insomnia in Children …
![Figure 1. One-carbon metabolism. Abbreviations: PLP, plasma pyridoxal phosphate; MTHFR, methylenetetrahydrofolate reductase; FAD, flavin adenine dinucleotide; FMN, flavin mononucleotide. Adapted from [16].](https://pdfs.citedhealth.com/figures/27854316/97.png)
One-carbon metabolism pathways involving folate, vitamin B12, and vitamin B6 are mapped, showing key enzymatic reactions catalyzed by MTHFR and the roles of FAD and FMN as cofactors in homocysteine recycling.
Causes, Consequences and Public Health Implications of Low B-Vitamin Status in Ageing.
![Figure 1. The iRISA syndrome [76] in addiction is centrally controlled by dopamine in the brain, while asynchronization, presumed to be linked to cue sensitivity in digital addiction [50–54], is centrally controlled by serotonin. A deficit in both neurotra](https://pdfs.citedhealth.com/figures/35682491/101.png)
The impaired Response Inhibition and Salience Attribution (iRISA) syndrome model is illustrated, showing how dopamine-mediated reward pathways in the brain drive cue sensitivity in digital addiction and contribute to sleep disruption.
Digital Addiction and Sleep.
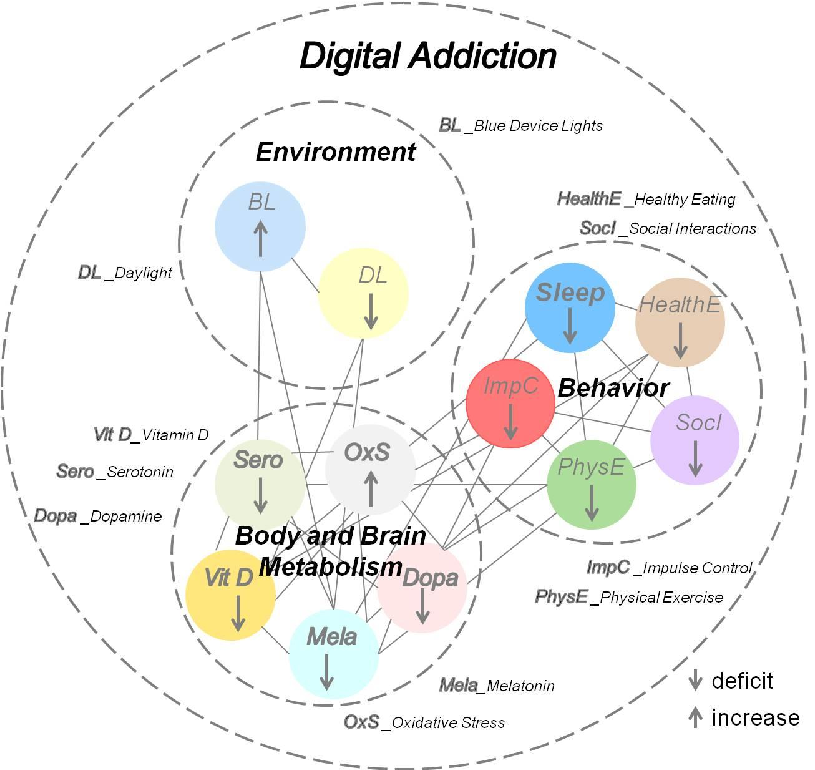
Neurobiological mechanisms linking excessive digital device use to disrupted sleep architecture are outlined, connecting screen-mediated blue light exposure and dopaminergic reward activation to circadian rhythm disturbances.
Digital Addiction and Sleep.
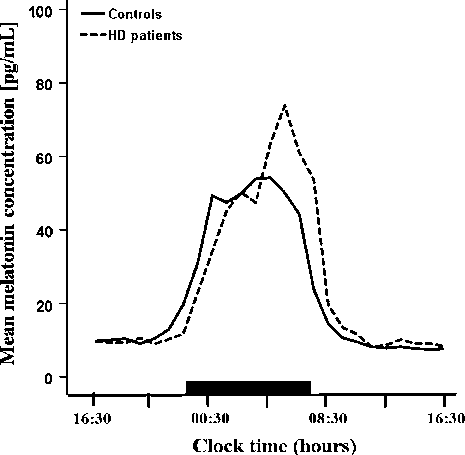
Mean 24-hour melatonin profiles in Huntington's disease patients and matched healthy controls are plotted, revealing a statistically significant delay of approximately 1.5 hours in the diurnal melatonin rise among HD patients (p = 0.048).
Delayed onset of the diurnal melatonin rise in patients with Huntington's disease.
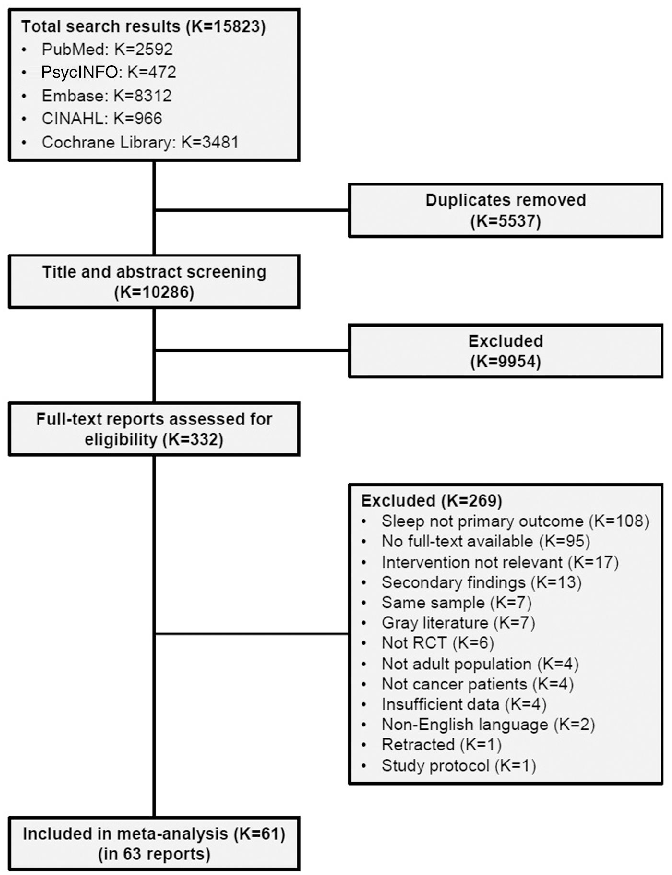
A PRISMA flow diagram tracks the study selection process from initial database search through screening and eligibility assessment to final inclusion in the aroma inhalation therapy meta-analysis.
A systematic literature review and meta-analysis of the clinical effects of aroma …
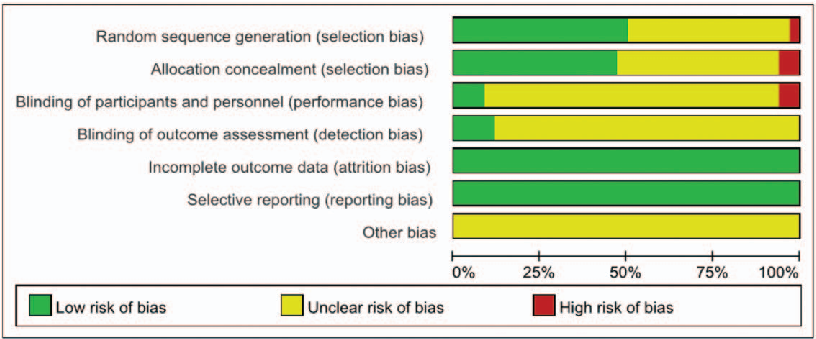
Risk of bias assessment across included studies evaluates methodological quality domains such as randomization, blinding, and outcome reporting in aroma therapy trials.
A systematic literature review and meta-analysis of the clinical effects of aroma …
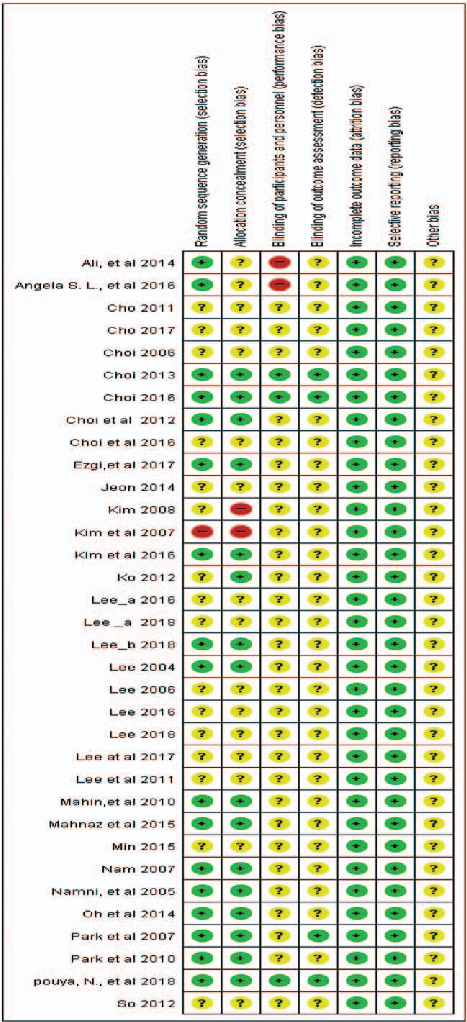
Traffic-light visualization of risk of bias for individual studies included in the aroma inhalation therapy meta-analysis, generated using RevMan software, reveals varying methodological quality.
A systematic literature review and meta-analysis of the clinical effects of aroma …
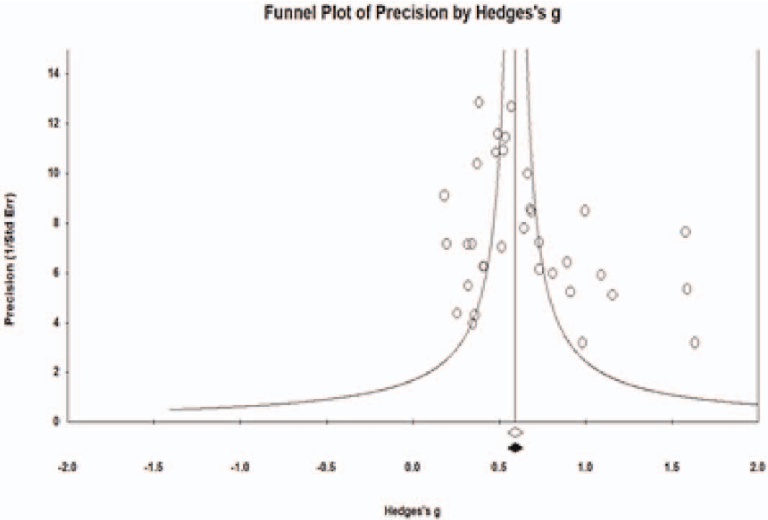
Funnel plot analysis assesses potential publication bias among studies included in the meta-analysis of aroma inhalation therapy for sleep problems, with symmetry indicating low risk.
A systematic literature review and meta-analysis of the clinical effects of aroma …
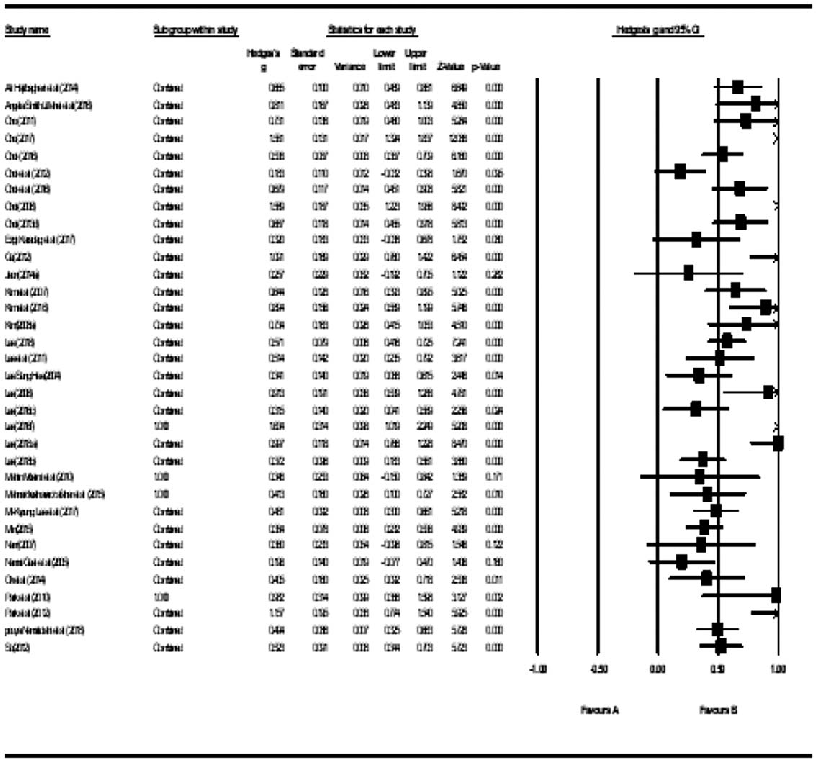
Forest plot of pooled effect sizes from the aroma inhalation therapy meta-analysis displays individual study results and the overall combined effect on sleep quality outcomes.
A systematic literature review and meta-analysis of the clinical effects of aroma …
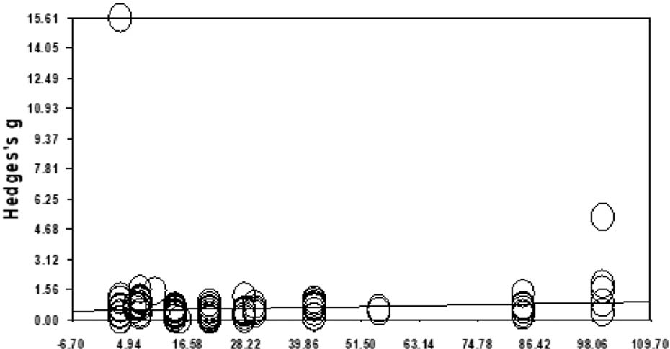
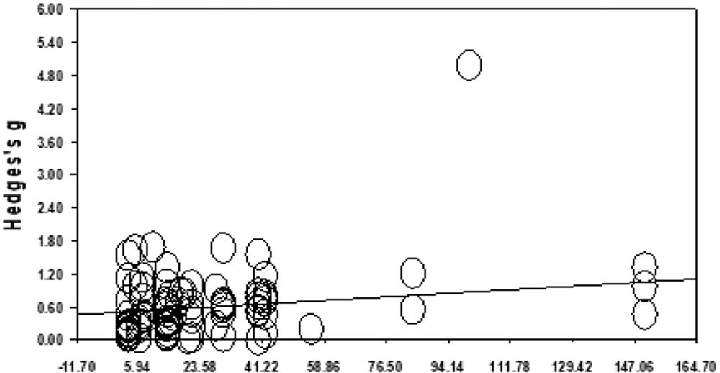
Meta-regression analysis examines whether the effectiveness of aroma inhalation therapy for sleep problems varies by program duration or publication year, revealing trends in the slope of the primary outcome.
A systematic literature review and meta-analysis of the clinical effects of aroma …
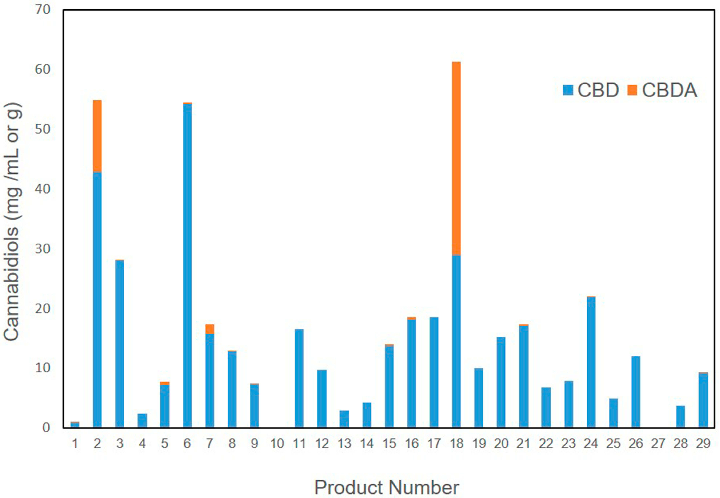
Overall quality assessment of commercial veterinary hemp supplements integrates cannabinoid accuracy, heavy metal safety, and terpene characterization. Substantial product-to-product variability underscores the need for standardized manufacturing.
Cannabinoid, Terpene, and Heavy Metal Analysis of 29 Over-the-Counter Commercial Veterinary Hemp …
Forest plot showing melatonin's effect on total sleep time across included studies. The overall effect suggests a small increase in sleep duration, with considerable heterogeneity between studies.
Melatonin as a Chronobiotic with Sleep-promoting Properties.
Dose-response analysis of melatonin supplementation on sleep parameters, indicating that lower physiological doses may be as effective as higher pharmacological doses for circadian rhythm regulation.
Melatonin as a Chronobiotic with Sleep-promoting Properties.
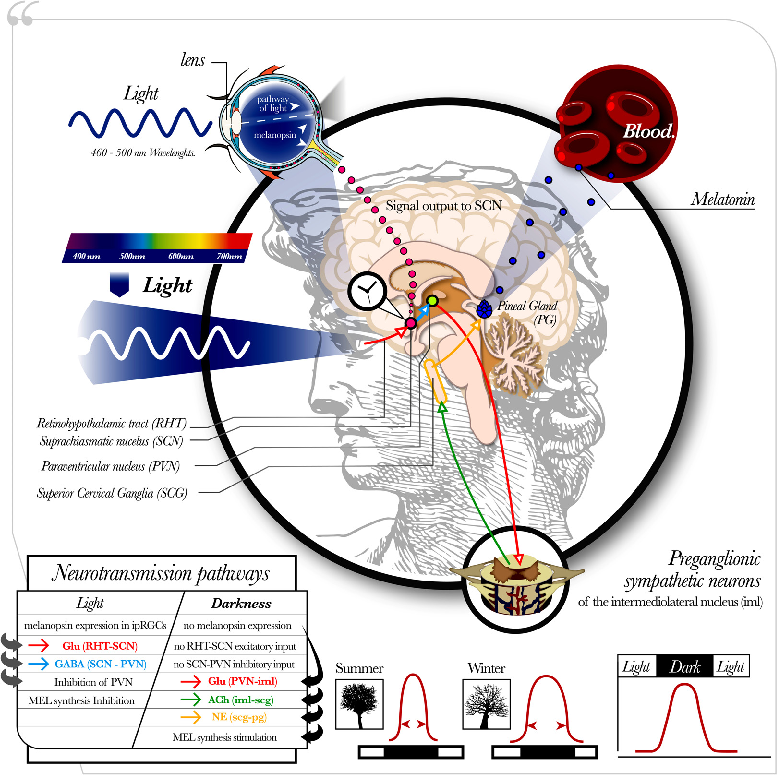
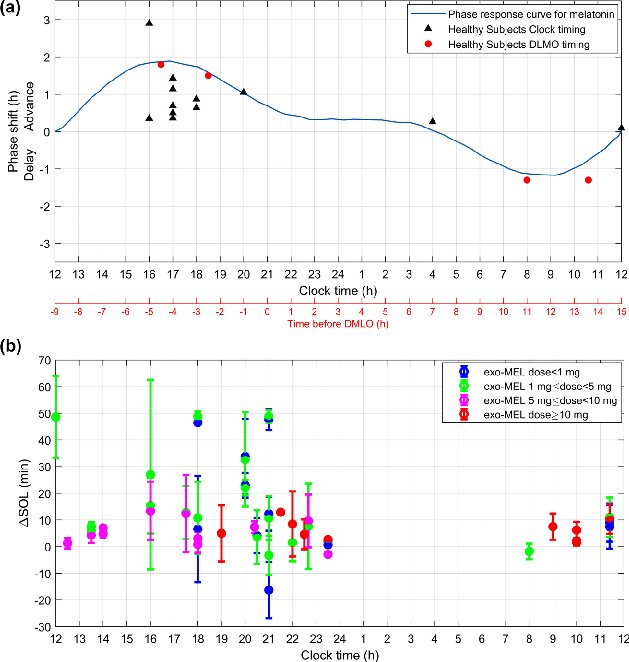
Circadian phase-response curve for exogenous melatonin, demonstrating how timing of administration determines whether it advances or delays the circadian clock.
Melatonin as a Chronobiotic with Sleep-promoting Properties.
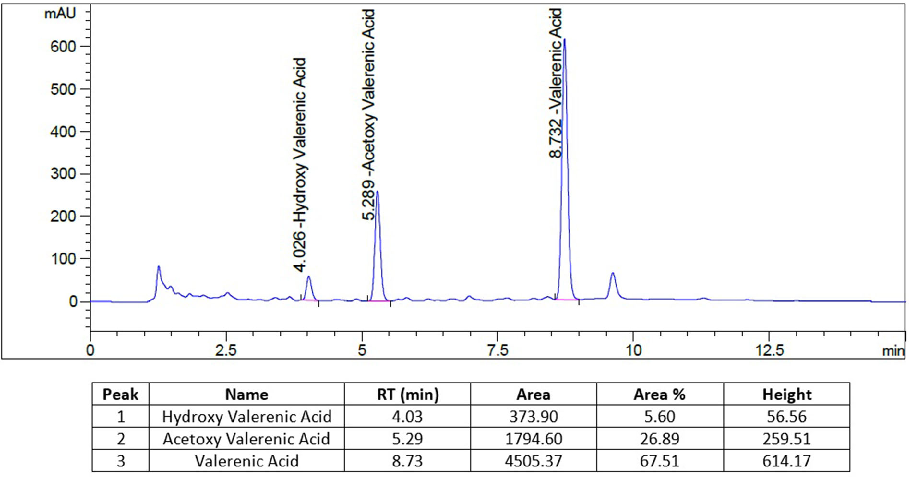
Standardized Extract of Valeriana officinalis Improves Overall Sleep Quality in Human Subjects …
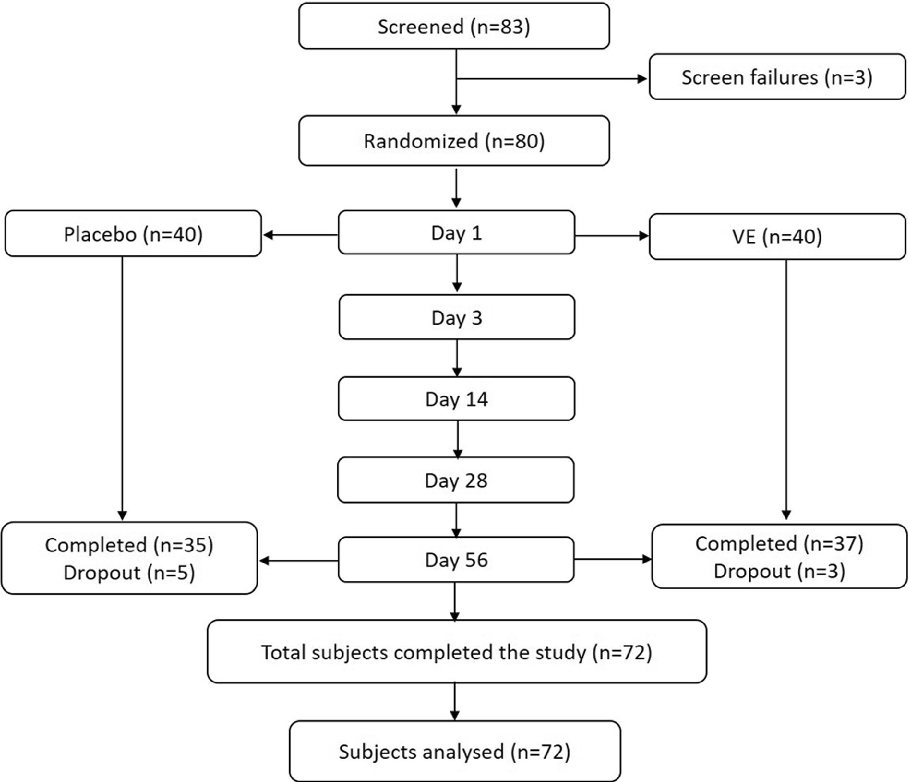
Standardized Extract of Valeriana officinalis Improves Overall Sleep Quality in Human Subjects …
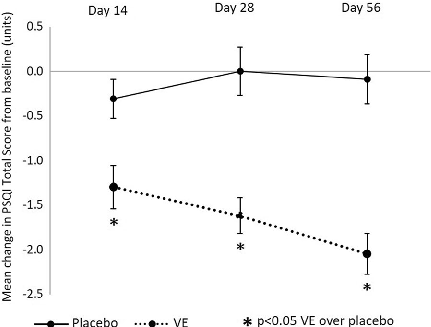
Fig. 3 Summary results of placebo versus VE mean change from baseline in PSQI total score (units)
Standardized Extract of Valeriana officinalis Improves Overall Sleep Quality in Human Subjects …
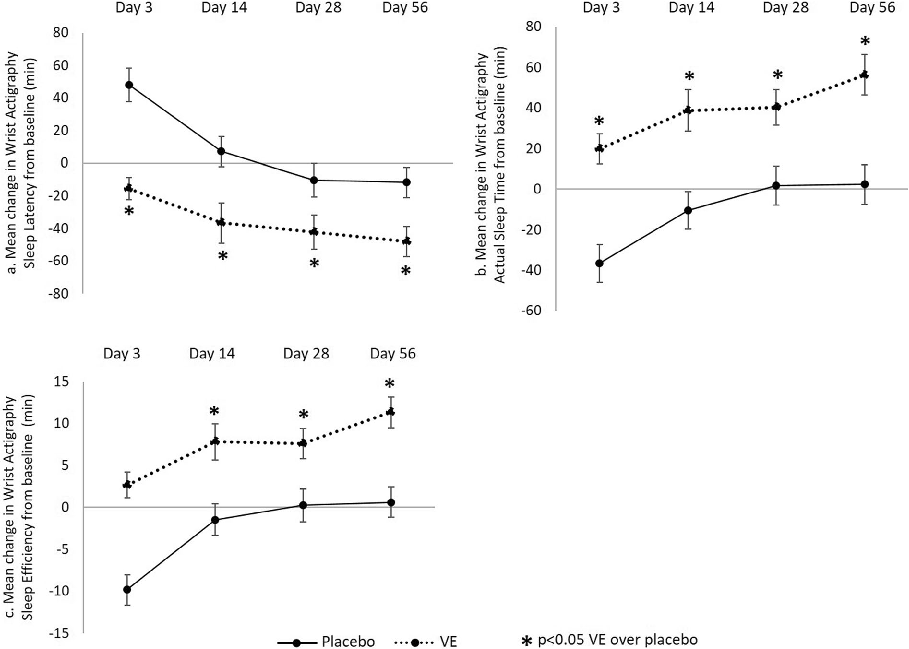
Fig. 4 Summary results of placebo versus VE mean change from baseline by wrist actigraphy in: a sleep latency (min); b actual sleep time (min); and c sleep efficiency (min)
Standardized Extract of Valeriana officinalis Improves Overall Sleep Quality in Human Subjects …
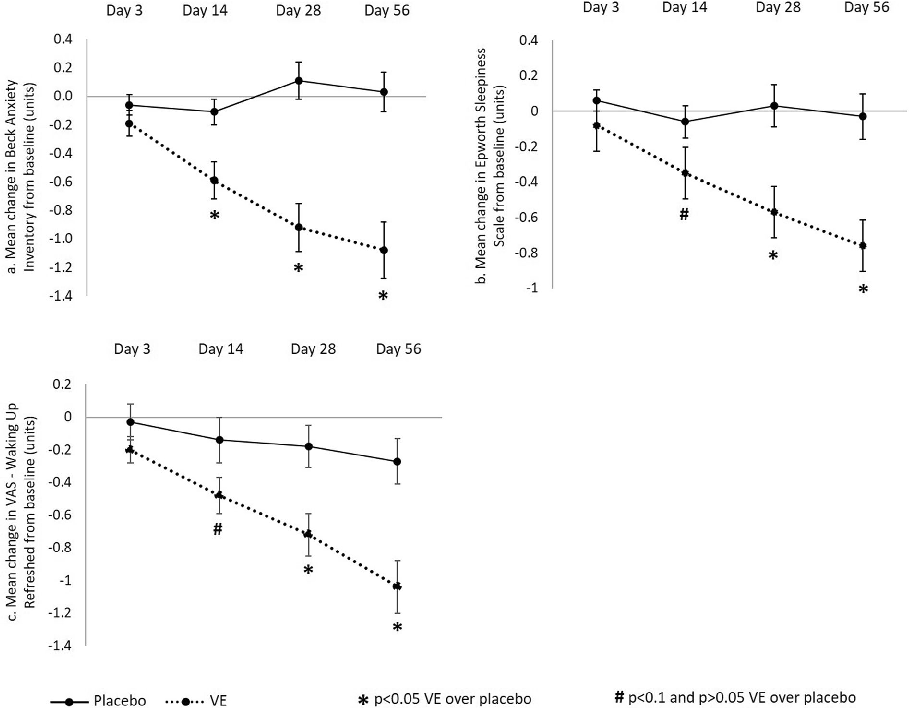
Fig. 5 Summary results of placebo versus VE mean change from baseline in: a Beck Anxiety Inventory (units); b Epworth Sleepiness Scale (units); and c VAS waking up refreshed (units)
Standardized Extract of Valeriana officinalis Improves Overall Sleep Quality in Human Subjects …
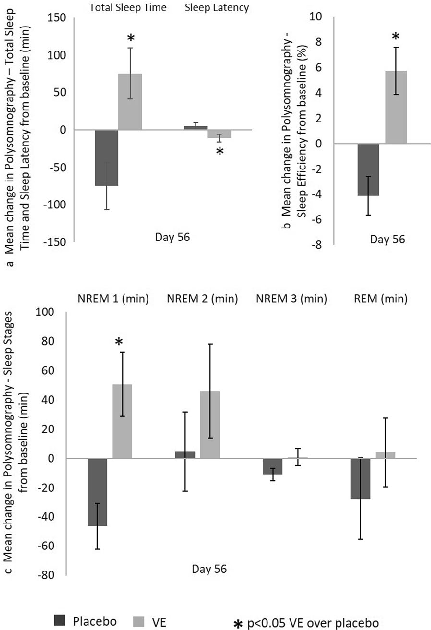
Fig. 6 Summary of placebo versus VE PSG results. Mean change from baseline in: a total sleep time and sleep latency (min); b sleep efficiency (%); and c sleep stages …
Standardized Extract of Valeriana officinalis Improves Overall Sleep Quality in Human Subjects …
Interventions for insomnia in cancer patients and survivors-a comprehensive systematic review and …
Seite 2 von 7