Tryptophan Abbildungen
10 Abbildungen aus begutachteter Forschung
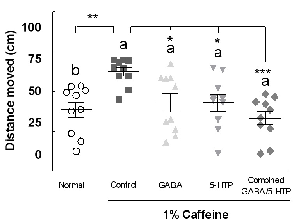
Two combined amino acids promote sleep activity in caffeine-induced sleepless model systems.
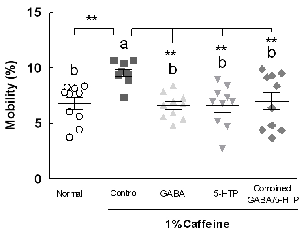
Two combined amino acids promote sleep activity in caffeine-induced sleepless model systems.
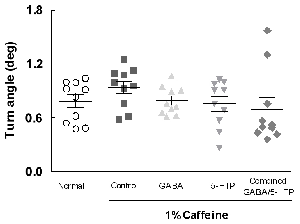
Two combined amino acids promote sleep activity in caffeine-induced sleepless model systems.
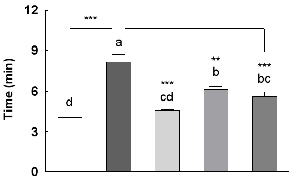
Two combined amino acids promote sleep activity in caffeine-induced sleepless model systems.
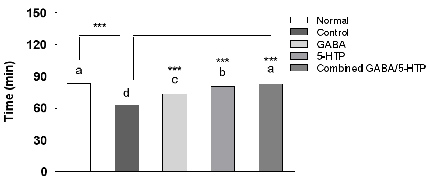
Group Dose (mg/kg) Caffeine (mg/kg) No. falling sleep/total Sleep onset (%) Sleep duration (min) Normal 0 0 6/13 46.15 29.72 ± 2.13a Control 0 10 6/15 40.00 16.40 ± 0.49c …
Two combined amino acids promote sleep activity in caffeine-induced sleepless model systems.
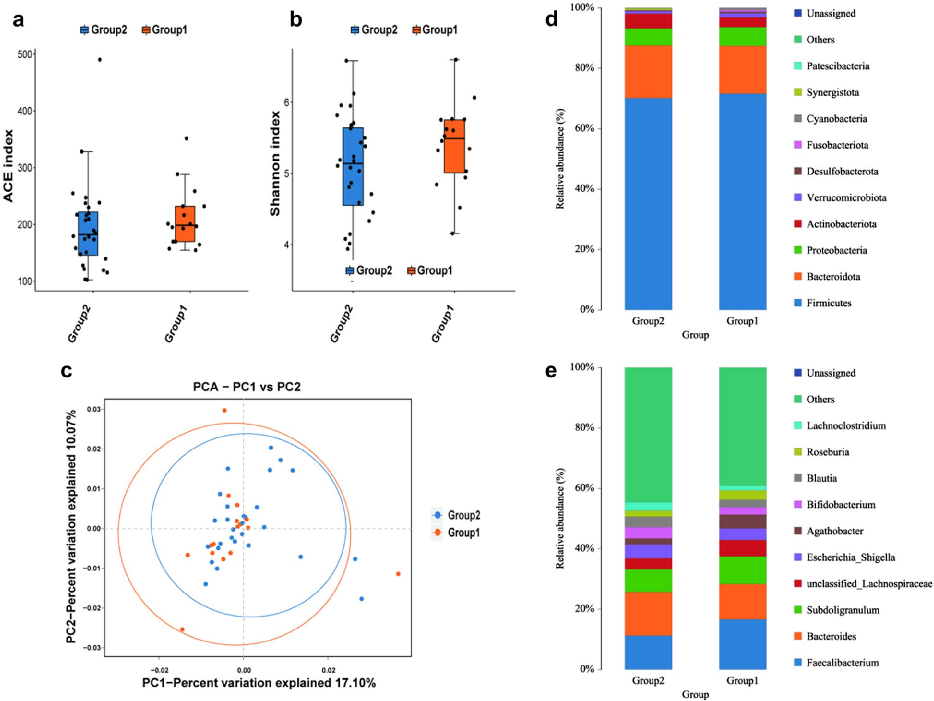
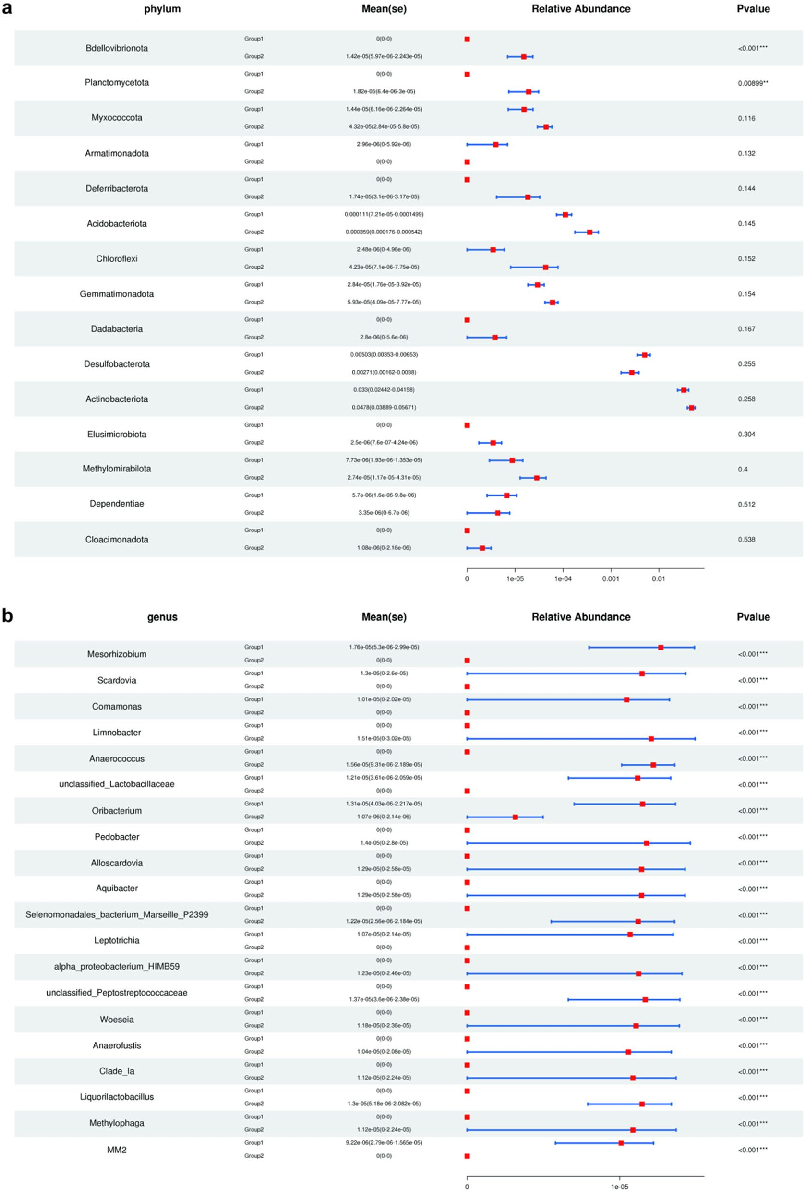
Study on gut microbiota and metabolomics in postmenopausal women.
Study on gut microbiota and metabolomics in postmenopausal women.
Study on gut microbiota and metabolomics in postmenopausal women.
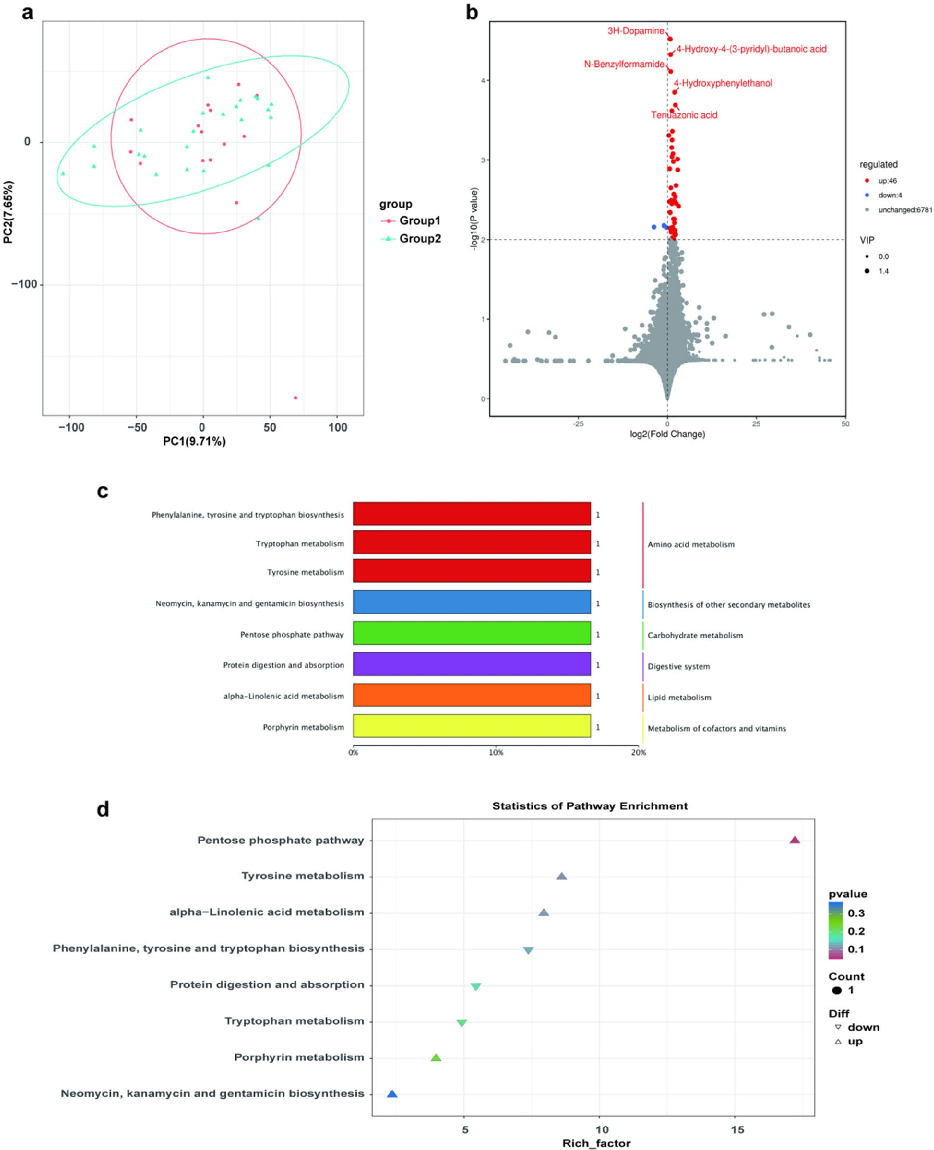
Study on gut microbiota and metabolomics in postmenopausal women.
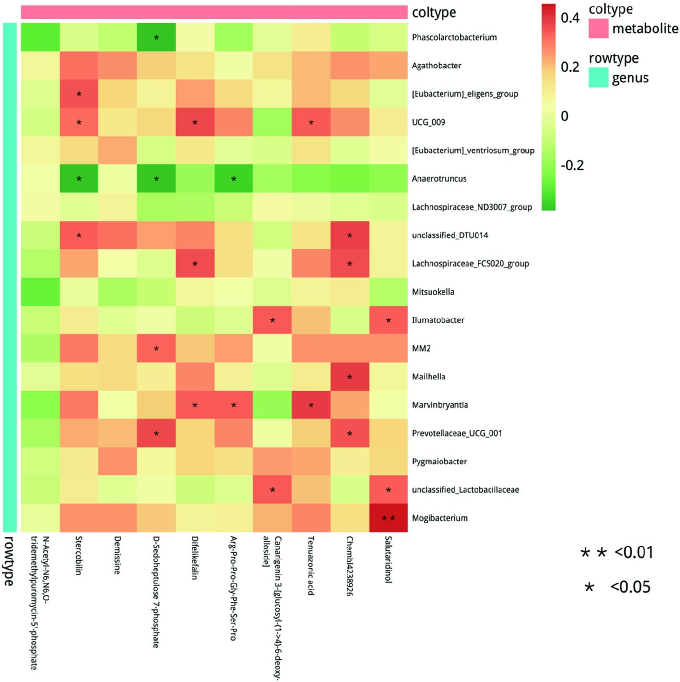
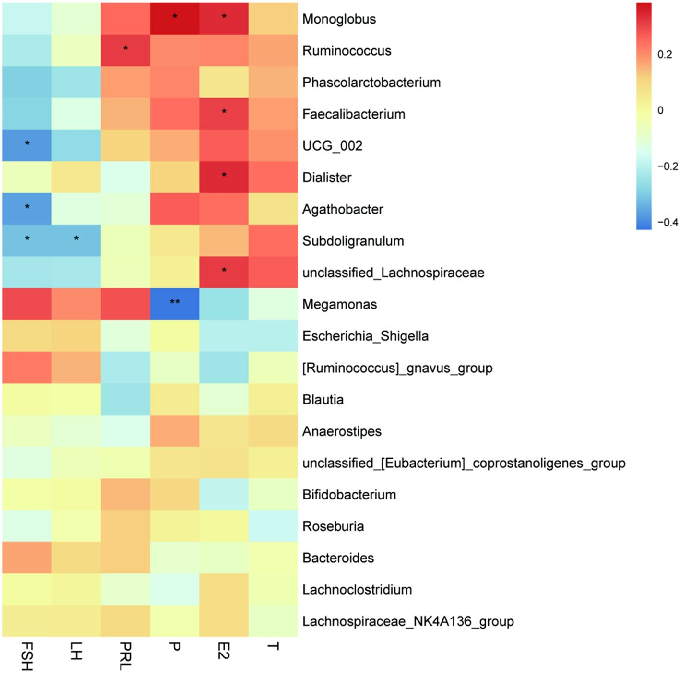
Fig. 5 The relationship between gut microbiota and gut metabolism, with red and yellow indicating positive correlation and green indicating negative correlation. The significance of the chart is represented as …
Study on gut microbiota and metabolomics in postmenopausal women.